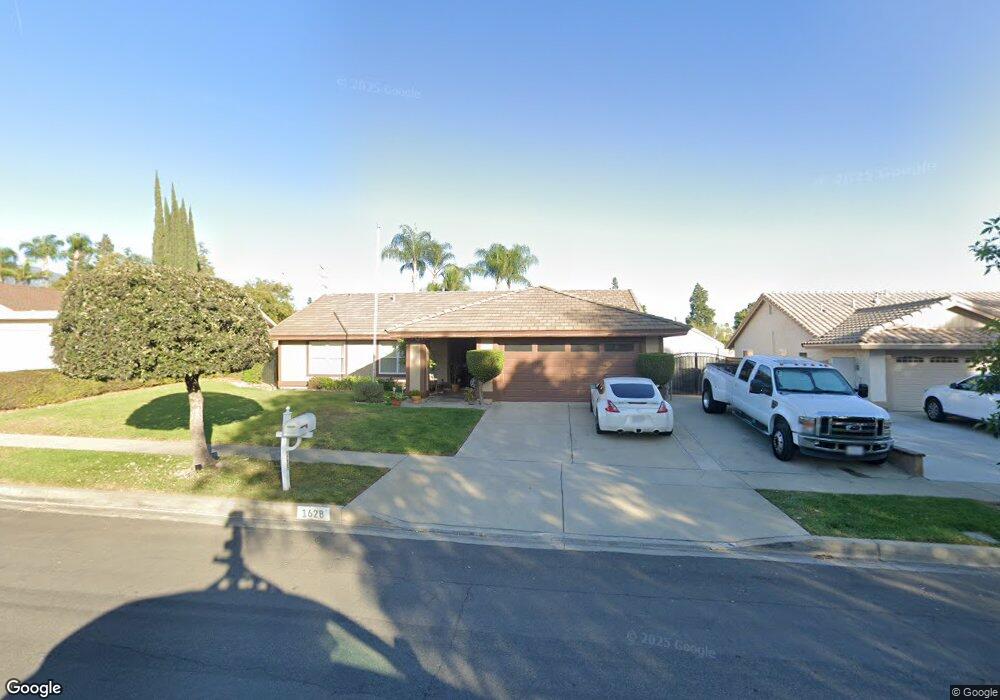
1628 Winston Way Upland, CA 91784
Estimated Value: $882,000 - $967,000
4
Beds
2
Baths
1,954
Sq Ft
$469/Sq Ft
Est. Value
About This Home
This home is located at 1628 Winston Way, Upland, CA 91784 and is currently estimated at $915,966, approximately $468 per square foot. 1628 Winston Way is a home located in San Bernardino County with nearby schools including Sierra Vista Elementary School, Pioneer Junior High School, and Upland High School.
Ownership History
Date
Name
Owned For
Owner Type
Purchase Details
Closed on
Nov 5, 1998
Sold by
Federal Home Loan Mortgage Corporation
Bought by
Morris Danny J and Morris Jennifer L
Current Estimated Value
Home Financials for this Owner
Home Financials are based on the most recent Mortgage that was taken out on this home.
Original Mortgage
$189,050
Outstanding Balance
$39,127
Interest Rate
6.54%
Estimated Equity
$876,839
Purchase Details
Closed on
Aug 10, 1998
Sold by
Foreman Kenneth G and Foreman Bernadette F
Bought by
Federal Home Loan Mortgage Corporation
Purchase Details
Closed on
Aug 11, 1994
Sold by
Oles Arthur and Oles Arlene
Bought by
Foreman Kenneth G and Foreman Bernadette F
Home Financials for this Owner
Home Financials are based on the most recent Mortgage that was taken out on this home.
Original Mortgage
$175,250
Interest Rate
7.62%
Create a Home Valuation Report for This Property
The Home Valuation Report is an in-depth analysis detailing your home's value as well as a comparison with similar homes in the area
Home Values in the Area
Average Home Value in this Area
Purchase History
| Date | Buyer | Sale Price | Title Company |
|---|---|---|---|
| Morris Danny J | $199,000 | -- | |
| Federal Home Loan Mortgage Corporation | $170,000 | Fidelity National Title Ins | |
| Foreman Kenneth G | $184,500 | Orange Coast Title Co |
Source: Public Records
Mortgage History
| Date | Status | Borrower | Loan Amount |
|---|---|---|---|
| Open | Morris Danny J | $189,050 | |
| Previous Owner | Foreman Kenneth G | $175,250 |
Source: Public Records
Tax History Compared to Growth
Tax History
| Year | Tax Paid | Tax Assessment Tax Assessment Total Assessment is a certain percentage of the fair market value that is determined by local assessors to be the total taxable value of land and additions on the property. | Land | Improvement |
|---|---|---|---|---|
| 2025 | $3,724 | $346,255 | $109,745 | $236,510 |
| 2024 | $3,724 | $339,466 | $107,593 | $231,873 |
| 2023 | $3,665 | $332,809 | $105,483 | $227,326 |
| 2022 | $3,585 | $326,284 | $103,415 | $222,869 |
| 2021 | $3,577 | $319,886 | $101,387 | $218,499 |
| 2020 | $3,480 | $316,606 | $100,347 | $216,259 |
| 2019 | $3,467 | $310,398 | $98,379 | $212,019 |
| 2018 | $3,382 | $304,312 | $96,450 | $207,862 |
| 2017 | $3,284 | $298,345 | $94,559 | $203,786 |
| 2016 | $3,085 | $292,495 | $92,705 | $199,790 |
| 2015 | $3,013 | $288,101 | $91,312 | $196,789 |
| 2014 | $2,935 | $282,457 | $89,523 | $192,934 |
Source: Public Records
Map
Nearby Homes
- 1618 Winston Way
- 1031 Pebble Beach Dr
- 1477 Winston Ct
- 1060 Pebble Beach Dr Unit 58
- 1796 Sunnybrook Ave
- 809 Dylan Dr
- 1613 Masters Dr
- 1629 N Palm Ave
- 1476 Fernando Ave
- 1844 N 1st Ave
- 1695 N Palm Ave
- 1244 Winged Foot Dr Unit 24
- 1377 N 5th Ave
- 1248 Leggio Ln
- 1631 Palmer Ct
- 1404 N Euclid Ave
- 322 E 19th St
- 256 W 18th St
- 1373 Upland Hills Dr N Unit 169
- 388 Harford Place
- 1634 Winston Way
- 1622 Winston Way
- 558 E Monitor Ct
- 1640 Winston Way
- 576 E Monitor Ct
- 561 E Merrimac Ct
- 577 E Merrimac Ct
- 1629 Winston Way
- 471 E Merrimac St
- 1637 Winston Way
- 559 E Monitor Ct
- 1646 Winston Way
- 1612 Winston Way
- 1643 Winston Way
- 590 E Monitor Ct
- 560 E Merrimac Ct
- 453 E Merrimac St
- 591 E Merrimac Ct
- 575 E Monitor Ct
- 1604 Winston Way