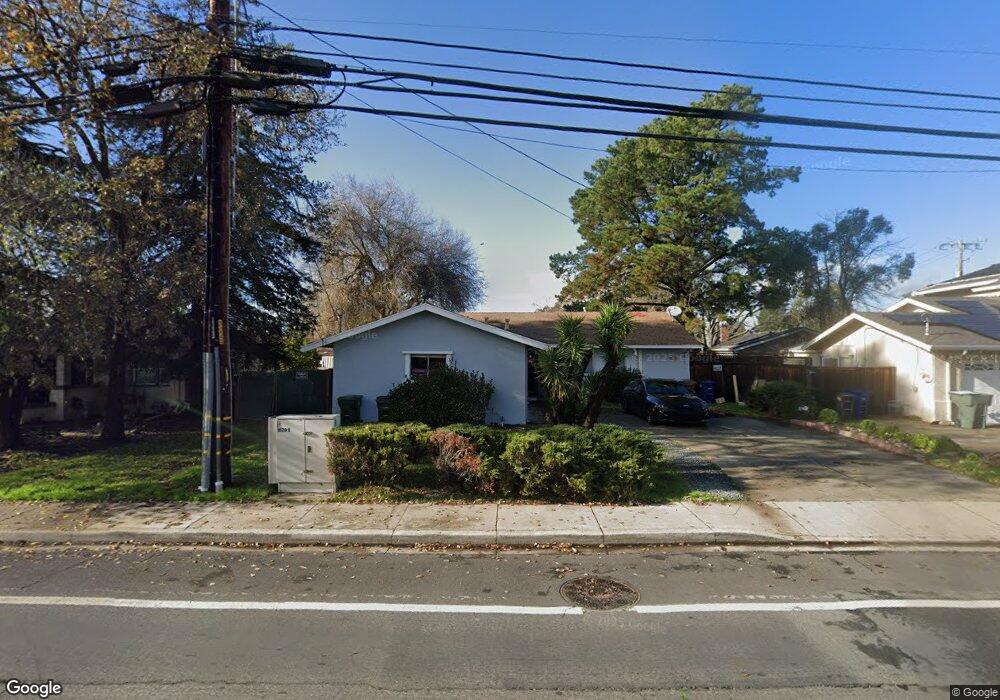
1629 Ayers Rd Concord, CA 94521
Heather Glen NeighborhoodEstimated Value: $715,482 - $844,000
3
Beds
2
Baths
1,379
Sq Ft
$566/Sq Ft
Est. Value
About This Home
This home is located at 1629 Ayers Rd, Concord, CA 94521 and is currently estimated at $781,121, approximately $566 per square foot. 1629 Ayers Rd is a home located in Contra Costa County with nearby schools including Ayers Elementary School, Pine Hollow Middle School, and College Park High School.
Ownership History
Date
Name
Owned For
Owner Type
Purchase Details
Closed on
Jan 6, 2016
Sold by
Baldwin Bertha L
Bought by
Baldwin Bertha L
Current Estimated Value
Purchase Details
Closed on
Jan 10, 2006
Sold by
Baldwin Gary F and Baldwin Bertha L
Bought by
Baldwin Gary F and Baldwin Bertha L
Purchase Details
Closed on
Jul 18, 2000
Sold by
Baldwin Mark G and Baldwin Jeanne E
Bought by
Baldwin Gary F and Baldwin Bertha L
Home Financials for this Owner
Home Financials are based on the most recent Mortgage that was taken out on this home.
Original Mortgage
$60,500
Interest Rate
8.2%
Mortgage Type
Purchase Money Mortgage
Purchase Details
Closed on
Mar 11, 1999
Sold by
Onopko Eugene & Sylvia C Tre
Bought by
Baldwin Mark G and Newstrom Jeanne E
Home Financials for this Owner
Home Financials are based on the most recent Mortgage that was taken out on this home.
Original Mortgage
$199,664
Outstanding Balance
$48,117
Interest Rate
6.7%
Mortgage Type
FHA
Estimated Equity
$733,004
Create a Home Valuation Report for This Property
The Home Valuation Report is an in-depth analysis detailing your home's value as well as a comparison with similar homes in the area
Home Values in the Area
Average Home Value in this Area
Purchase History
| Date | Buyer | Sale Price | Title Company |
|---|---|---|---|
| Baldwin Bertha L | -- | None Available | |
| Baldwin Gary F | -- | None Available | |
| Baldwin Gary F | $226,000 | First American Title Guarant | |
| Baldwin Mark G | $201,000 | Fidelity National Title Co |
Source: Public Records
Mortgage History
| Date | Status | Borrower | Loan Amount |
|---|---|---|---|
| Closed | Baldwin Gary F | $60,500 | |
| Open | Baldwin Mark G | $199,664 |
Source: Public Records
Tax History
| Year | Tax Paid | Tax Assessment Tax Assessment Total Assessment is a certain percentage of the fair market value that is determined by local assessors to be the total taxable value of land and additions on the property. | Land | Improvement |
|---|---|---|---|---|
| 2025 | $4,811 | $344,291 | $173,275 | $171,016 |
| 2024 | $4,578 | $337,541 | $169,878 | $167,663 |
| 2023 | $4,578 | $330,924 | $166,548 | $164,376 |
| 2022 | $4,504 | $324,436 | $163,283 | $161,153 |
| 2021 | $4,383 | $318,076 | $160,082 | $157,994 |
| 2019 | $4,291 | $308,643 | $155,335 | $153,308 |
| 2018 | $4,122 | $302,592 | $152,290 | $150,302 |
| 2017 | $3,977 | $296,659 | $149,304 | $147,355 |
| 2016 | $3,852 | $290,843 | $146,377 | $144,466 |
| 2015 | $3,791 | $286,475 | $144,179 | $142,296 |
| 2014 | $3,710 | $280,864 | $141,355 | $139,509 |
Source: Public Records
Map
Nearby Homes
- 1560 Ayers Rd
- 5070 Bonwell Dr
- 5179 Paul Scarlet Dr
- 1590 Laverne Way
- 5169 Concord Blvd
- 5174 Jomar Dr
- 1543 Laverne Ct
- 1531 Garcez Dr
- 5055 Valley Crest Dr Unit 196
- 5035 Valley Crest Dr Unit 169
- 5025 Valley Crest Dr Unit 147
- 5060 Valley Crest Dr Unit 56
- 5050 Valley Crest Dr Unit 63
- 5150 Brookside Ln
- 4888 Clayton Rd Unit 6
- 1520 Schenone Ct Unit 15
- 5091 Saint Celestine Ct
- 1535 Parkwood Place
- 5021 Murchio Dr
- 5017 Murchio Dr
Your Personal Tour Guide
Ask me questions while you tour the home.