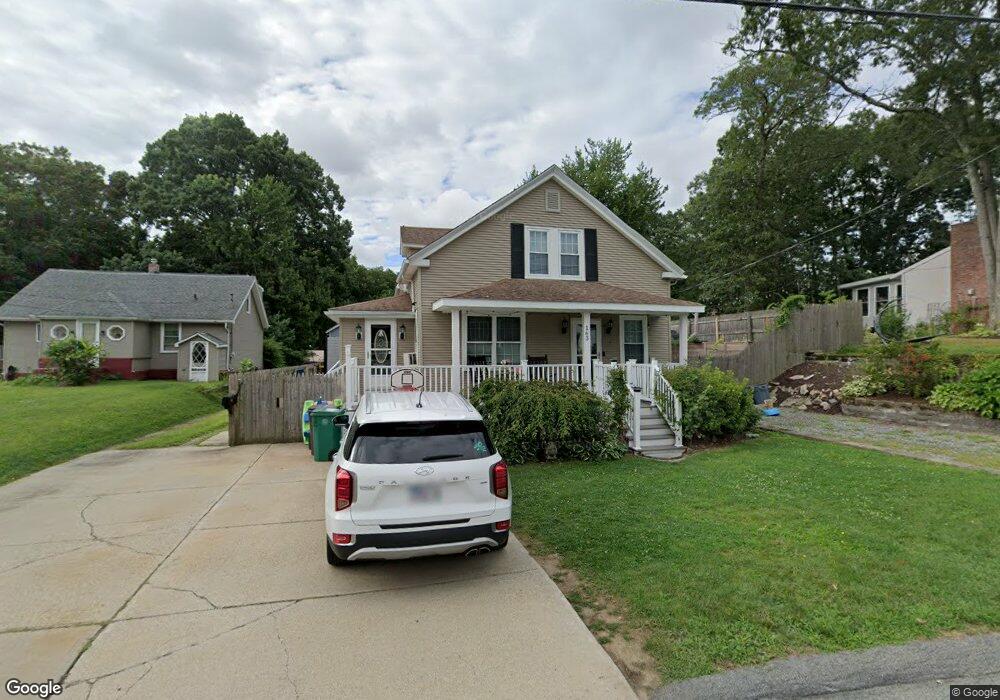
163 Congress St Woonsocket, RI 02895
East Woonsocket NeighborhoodEstimated Value: $384,000 - $422,000
3
Beds
2
Baths
1,471
Sq Ft
$268/Sq Ft
Est. Value
About This Home
This home is located at 163 Congress St, Woonsocket, RI 02895 and is currently estimated at $394,906, approximately $268 per square foot. 163 Congress St is a home located in Providence County with nearby schools including Woonsocket High School, Rise Prep Mayoral Academy Middle School, and Rise Prep Mayoral Academy.
Ownership History
Date
Name
Owned For
Owner Type
Purchase Details
Closed on
Oct 31, 2008
Sold by
Angelus Denise
Bought by
Enright Lawrence E and Enright Karen Lee
Current Estimated Value
Purchase Details
Closed on
Jun 27, 1990
Sold by
Lamarche Albert L
Bought by
Enright Lawrence E
Home Financials for this Owner
Home Financials are based on the most recent Mortgage that was taken out on this home.
Original Mortgage
$94,150
Interest Rate
10.27%
Mortgage Type
Purchase Money Mortgage
Create a Home Valuation Report for This Property
The Home Valuation Report is an in-depth analysis detailing your home's value as well as a comparison with similar homes in the area
Home Values in the Area
Average Home Value in this Area
Purchase History
| Date | Buyer | Sale Price | Title Company |
|---|---|---|---|
| Enright Lawrence E | $15,000 | -- | |
| Enright Lawrence E | $15,000 | -- | |
| Enright Lawrence E | $93,000 | -- |
Source: Public Records
Mortgage History
| Date | Status | Borrower | Loan Amount |
|---|---|---|---|
| Previous Owner | Enright Lawrence E | $190,000 | |
| Previous Owner | Enright Lawrence E | $18,000 | |
| Previous Owner | Enright Lawrence E | $87,600 | |
| Previous Owner | Enright Lawrence E | $94,150 |
Source: Public Records
Tax History
| Year | Tax Paid | Tax Assessment Tax Assessment Total Assessment is a certain percentage of the fair market value that is determined by local assessors to be the total taxable value of land and additions on the property. | Land | Improvement |
|---|---|---|---|---|
| 2025 | $3,936 | $350,500 | $107,200 | $243,300 |
| 2024 | $3,843 | $264,300 | $95,000 | $169,300 |
| 2023 | $3,695 | $264,300 | $95,000 | $169,300 |
| 2022 | $3,695 | $264,300 | $95,000 | $169,300 |
| 2021 | $3,805 | $160,200 | $59,800 | $100,400 |
| 2020 | $3,845 | $160,200 | $59,800 | $100,400 |
| 2018 | $3,858 | $160,200 | $59,800 | $100,400 |
| 2017 | $4,033 | $134,000 | $46,700 | $87,300 |
| 2016 | $4,267 | $134,000 | $46,700 | $87,300 |
| 2015 | $4,902 | $134,000 | $46,700 | $87,300 |
| 2014 | $4,665 | $129,800 | $51,400 | $78,400 |
Source: Public Records
Map
Nearby Homes
- 375 Congress St
- 372 Cumberland Hill Rd
- 68 Kenwood St
- 34 Heroux Ave
- 568 Elm St
- 56 Mailloux St
- 414 Rhode Island Ave
- 410 Carrington Ave
- 311 Elm St
- 271 Elm St
- 346 Carrington Ave
- 95 Mitris Blvd
- 263 Elm St
- 39 Louise St
- 345 Carrington Ave
- 40 Burnside Ave
- 18 Villa Nova St
- 727 Mendon Rd
- 74 Maple St
- 202 Phillips St
Your Personal Tour Guide
Ask me questions while you tour the home.