163 E Weisheimer Rd Columbus, OH 43214
Clintonville NeighborhoodEstimated Value: $333,300 - $367,000
About This Home
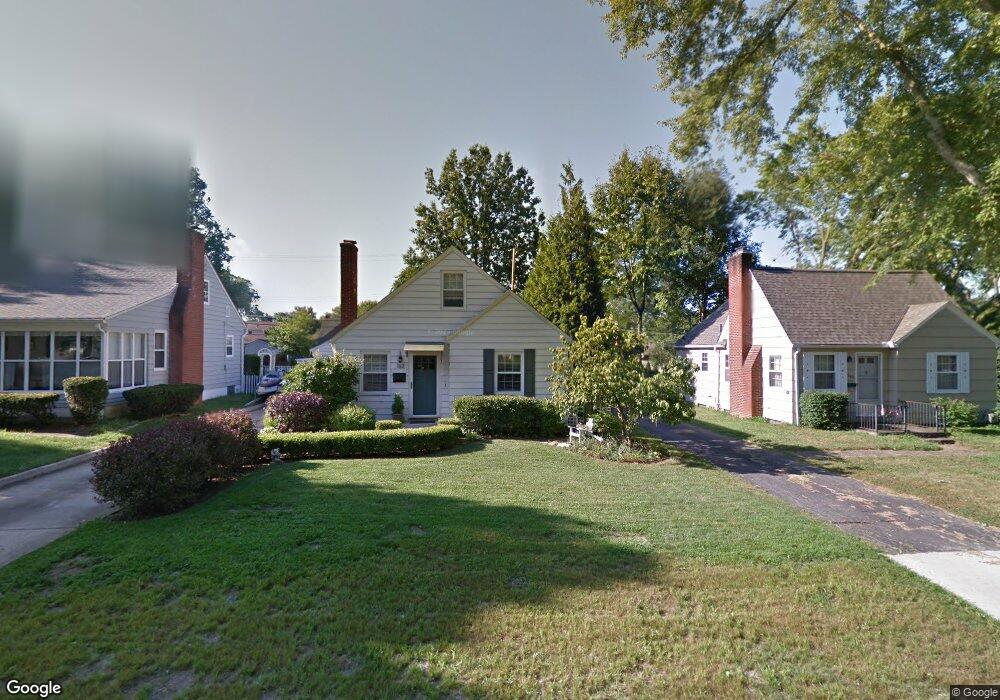
This home is located at 163 E Weisheimer Rd, Columbus, OH 43214 and is currently estimated at $351,825, approximately $340 per square foot. 163 E Weisheimer Rd is a home located in Franklin County with nearby schools including Indian Springs Elementary School, Dominion Middle School, and Whetstone High School.
Ownership History
We collect this data history from publicly available records. To have your information removed, we recommend requesting removal directly through your county’s website.
Purchase Details
Home Financials for this Owner
Home Financials are based on the most recent Mortgage that was taken out on this home.Purchase Details
Home Financials for this Owner
Home Financials are based on the most recent Mortgage that was taken out on this home.Purchase Details
Home Values in the Area
Average Home Value in this Area
Purchase History
We collect this data history from publicly available records. To have your information removed, we recommend requesting removal directly through your county’s website.
| Date | Buyer | Sale Price | Title Company |
|---|---|---|---|
| $157,500 | Valmer Land | ||
| $127,900 | The Title Company Ltd | ||
| -- | -- |
Mortgage History
We collect this data history from publicly available records. To have your information removed, we recommend requesting removal directly through your county’s website.
| Date | Status | Borrower | Loan Amount |
|---|---|---|---|
| Open | $80,000 | ||
| Closed | $115,100 |
Tax History
We collect this data history from publicly available records. To have your information removed, we recommend requesting removal directly through your county’s website.
| Year | Tax Paid | Tax Assessment Tax Assessment Total Assessment is a certain percentage of the fair market value that is determined by local assessors to be the total taxable value of land and additions on the property. | Land | Improvement |
|---|---|---|---|---|
| 2025 | $3,869 | $96,010 | $45,190 | $50,820 |
| 2024 | $3,869 | $96,010 | $45,190 | $50,820 |
| 2023 | $3,848 | $96,005 | $45,185 | $50,820 |
| 2022 | $3,929 | $75,750 | $32,240 | $43,510 |
| 2021 | $3,936 | $75,750 | $32,240 | $43,510 |
| 2020 | $3,941 | $75,750 | $32,240 | $43,510 |
| 2019 | $3,519 | $58,000 | $24,780 | $33,220 |
| 2018 | $3,347 | $58,000 | $24,780 | $33,220 |
| 2017 | $3,511 | $58,000 | $24,780 | $33,220 |
| 2016 | $3,506 | $52,930 | $18,450 | $34,480 |
| 2015 | $3,183 | $52,930 | $18,450 | $34,480 |
| 2014 | $3,191 | $52,930 | $18,450 | $34,480 |
| 2013 | $1,498 | $50,400 | $17,570 | $32,830 |
Map
- 154 Desantis Dr
- 260 Dixon Ct
- 27 Garden Rd
- 51 E Schreyer Place
- 121 E Beechwold Blvd
- 275 E Royal Forest Blvd
- 289 E Royal Forest Blvd
- 4457 Rosemary Pkwy
- 4405 Rosemary Pkwy
- 165 Morse Rd
- 111 Morse Rd
- 175 W Weisheimer Rd
- 445 Fairlawn Dr
- 451 Fairlawn Dr
- 495 E Beechwold Blvd
- 392 E Jeffrey Place
- 133 Aldrich Rd
- 25 Deland Ave
- 139 Aldrich Rd
- 522 E Beechwold Blvd
- 183 E Weisheimer Rd
- 169 E Weisheimer Rd
- 189 E Weisheimer Rd
- 0 E Weisheimer Rd
- 174 Desantis Dr
- 155 E Weisheimer Rd
- 180 Desantis Dr
- 168 Desantis Dr
- 188 Desantis Dr
- 199 E Weisheimer Rd
- 178 E Weisheimer Rd
- 160 Desantis Dr
- 170 E Weisheimer Rd
- 184 E Weisheimer Rd
- 149 E Weisheimer Rd
- 196 Desantis Dr
- 190 E Weisheimer Rd
- 196 E Weisheimer Rd
- 202 Desantis Dr
- 207 E Weisheimer Rd
Ask me questions while you tour the home.