Estimated Value: $165,000 - $279,000
--
Bed
--
Bath
3,464
Sq Ft
$62/Sq Ft
Est. Value
About This Home
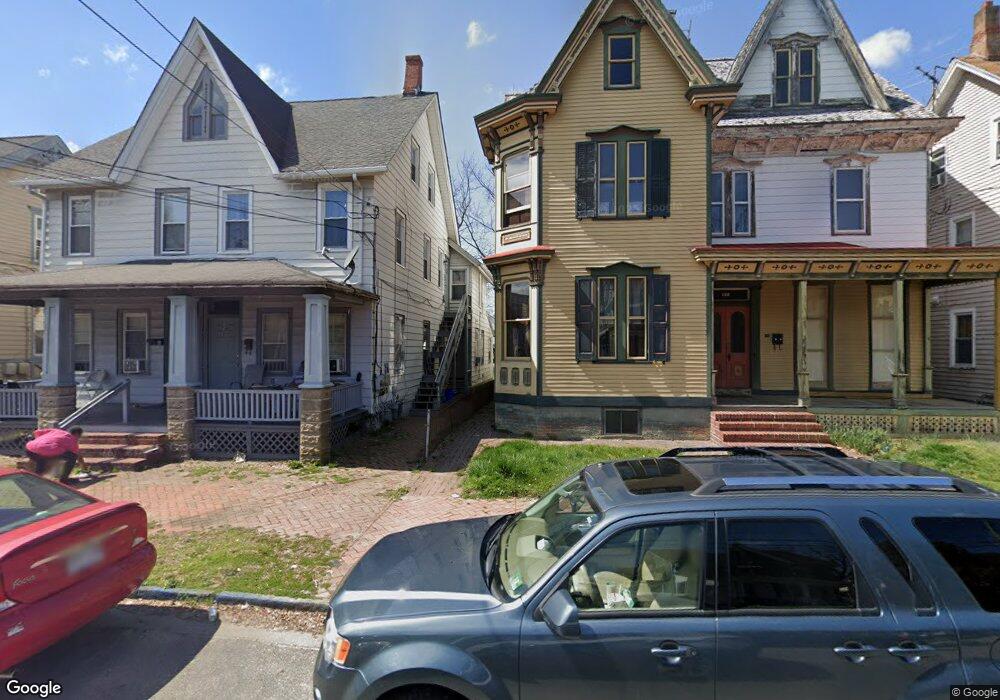
This home is located at 163 Seventh St Unit 165, Salem, NJ 08079 and is currently estimated at $214,431, approximately $61 per square foot. 163 Seventh St Unit 165 is a home located in Salem County with nearby schools including John Fenwick Elementary School, Salem Middle School, and Salem High School.
Ownership History
Date
Name
Owned For
Owner Type
Purchase Details
Closed on
Feb 10, 2020
Sold by
Fuse William G and Fuse Claudia D
Bought by
Vandoren Estates Llc
Current Estimated Value
Home Financials for this Owner
Home Financials are based on the most recent Mortgage that was taken out on this home.
Original Mortgage
$118,150
Outstanding Balance
$104,614
Interest Rate
3.6%
Mortgage Type
Future Advance Clause Open End Mortgage
Estimated Equity
$109,817
Purchase Details
Closed on
Apr 30, 1992
Bought by
Fuse William G + Claudia D
Create a Home Valuation Report for This Property
The Home Valuation Report is an in-depth analysis detailing your home's value as well as a comparison with similar homes in the area
Home Values in the Area
Average Home Value in this Area
Purchase History
| Date | Buyer | Sale Price | Title Company |
|---|---|---|---|
| Vandoren Estates Llc | $139,000 | Connection Ttl Agcy Of Nj Ll | |
| Fuse William G + Claudia D | $70,000 | -- |
Source: Public Records
Mortgage History
| Date | Status | Borrower | Loan Amount |
|---|---|---|---|
| Open | Vandoren Estates Llc | $118,150 |
Source: Public Records
Tax History Compared to Growth
Tax History
| Year | Tax Paid | Tax Assessment Tax Assessment Total Assessment is a certain percentage of the fair market value that is determined by local assessors to be the total taxable value of land and additions on the property. | Land | Improvement |
|---|---|---|---|---|
| 2025 | $5,788 | $70,400 | $9,600 | $60,800 |
| 2024 | $5,534 | $70,400 | $9,600 | $60,800 |
| 2023 | $5,534 | $70,400 | $9,600 | $60,800 |
| 2022 | $5,292 | $70,400 | $9,600 | $60,800 |
| 2021 | $5,110 | $70,400 | $9,600 | $60,800 |
| 2020 | $5,007 | $70,400 | $9,600 | $60,800 |
| 2019 | $4,977 | $70,400 | $9,600 | $60,800 |
| 2018 | $4,867 | $70,400 | $9,600 | $60,800 |
| 2017 | $4,808 | $70,400 | $9,600 | $60,800 |
| 2016 | $4,347 | $111,000 | $15,100 | $95,900 |
| 2015 | $5,115 | $132,300 | $15,100 | $117,200 |
| 2014 | $5,088 | $132,300 | $15,100 | $117,200 |
Source: Public Records
Map
Nearby Homes