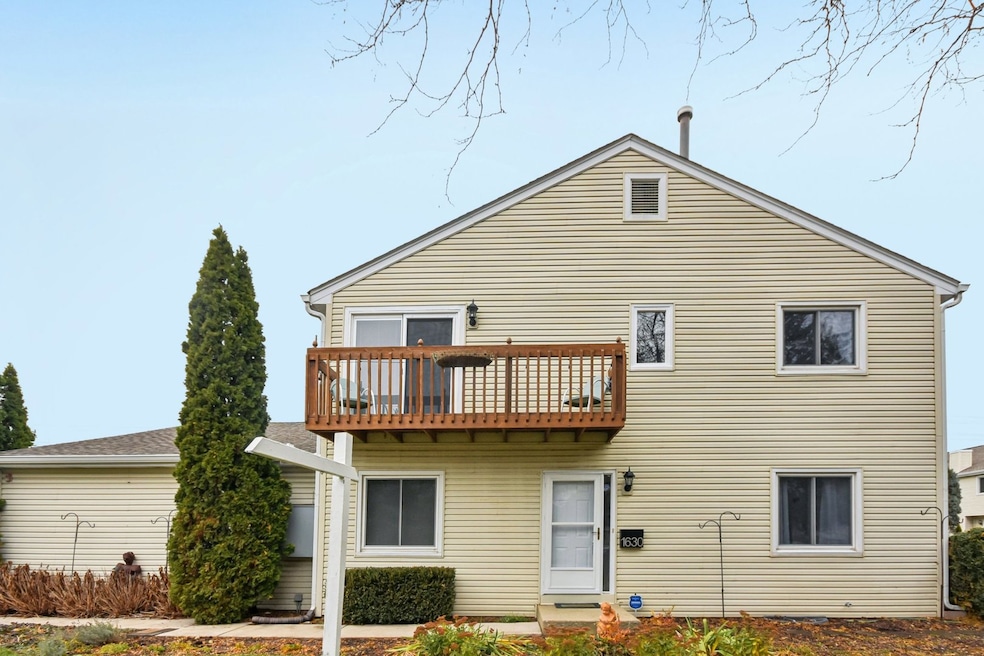
1630 Kemper Dr Naperville, IL 60563
Country Lakes NeighborhoodEstimated payment $2,659/month
Highlights
- Deck
- Wood Flooring
- Breakfast Room
- Longwood Elementary School Rated A-
- End Unit
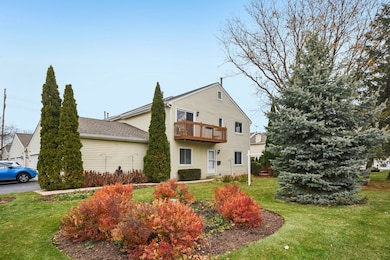
- 5-minute walk to Atwater Park
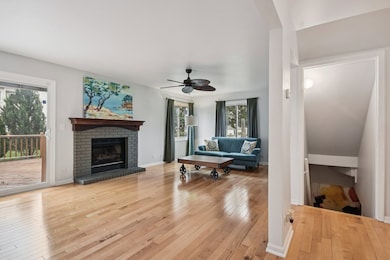
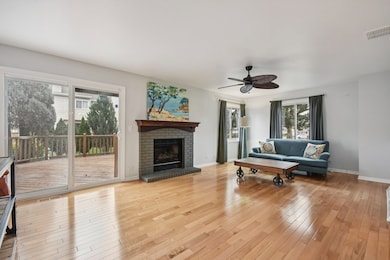
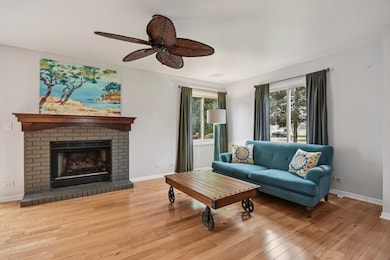
About This Home
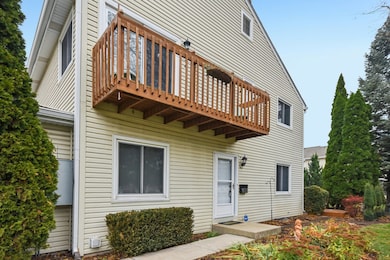
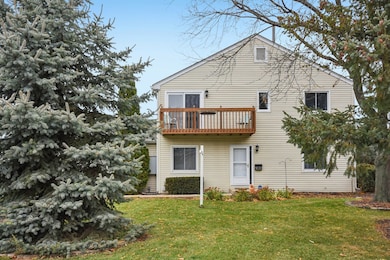
We are thrilled to present a meticulously maintained, pristine end-unit townhome that offers a fresh and highly desirable aesthetic. This property is move-in ready and boasts several significant upgrades that enhance both its functionality and appeal. Key interior features include a customized kitchen, updated in 2025, which showcases custom cabinetry and elegant granite countertops. The master bathroom, updated in 2024, also features custom finishes, contributing to the luxurious feel of the home. The customized master suite is a true retreat, offering vaulted ceilings, a spacious walk-in closet, and a private balcony perfect for enjoying your morning coffee. The main level provides distinct living and dining areas, complete with a cozy fireplace. Hardwood flooring extends throughout the home, adding to the home's sophisticated charm, and new stairs both upper and lower. Additional living space is found in the fully finished basement, which features durable engineered hardwood flooring. For outdoor enjoyment, an expansive, private deck offers an ideal setting for entertaining or relaxation. The roof and gutters were also replaced in 2021, ensuring the home's structural integrity and minimizing future maintenance concerns.
Listing Agent
Kimberly Brown-Lewis
Redfin Corporation Brokerage Phone: (224) 699-5002 License #475196946 Listed on: 11/20/2025

Townhouse Details
Home Type
- Townhome
Est. Annual Taxes
- $5,109
Year Built
- Built in 1989 | Remodeled in 2025
HOA Fees
- $245 Monthly HOA Fees
Parking
- 2 Car Garage
Home Design
- Entry on the 1st floor
Interior Spaces
- 1,518 Sq Ft Home
- 2-Story Property
- Ceiling Fan
- Skylights
- Gas Log Fireplace
- Insulated Windows
- Shades
- Blinds
- Six Panel Doors
- Family Room
- Living Room with Fireplace
- Breakfast Room
- Formal Dining Room
- Wood Flooring
Kitchen
- Range
- Microwave
- Dishwasher
- Stainless Steel Appliances
Bedrooms and Bathrooms
- 3 Bedrooms
- 3 Potential Bedrooms
- Walk-In Closet
- Separate Shower
Laundry
- Laundry Room
- Dryer
- Washer
Basement
- Basement Fills Entire Space Under The House
- Sump Pump
Outdoor Features
- Balcony
- Deck
Schools
- Longwood Elementary School
- Hill Middle School
- Metea Valley High School
Utilities
- Central Air
- Heating System Uses Natural Gas
- Lake Michigan Water
- Cable TV Available
Additional Features
- Doors are 36 inches wide or more
- End Unit
Listing and Financial Details
- Homeowner Tax Exemptions
Community Details
Overview
- Association fees include exterior maintenance, lawn care, snow removal
- 5 Units
- Psi Management Association, Phone Number (847) 806-6121
- Property managed by PSI Management
Pet Policy
- Dogs and Cats Allowed
Map
Home Values in the Area
Average Home Value in this Area
Tax History
| Year | Tax Paid | Tax Assessment Tax Assessment Total Assessment is a certain percentage of the fair market value that is determined by local assessors to be the total taxable value of land and additions on the property. | Land | Improvement |
|---|---|---|---|---|
| 2024 | $5,109 | $97,846 | $18,585 | $79,261 |
| 2023 | $4,809 | $87,920 | $16,700 | $71,220 |
| 2022 | $5,143 | $81,250 | $15,300 | $65,950 |
| 2021 | $4,973 | $78,350 | $14,750 | $63,600 |
| 2020 | $4,966 | $78,350 | $14,750 | $63,600 |
| 2019 | $4,761 | $74,520 | $14,030 | $60,490 |
| 2018 | $4,254 | $66,090 | $12,140 | $53,950 |
| 2017 | $4,128 | $63,850 | $11,730 | $52,120 |
| 2016 | $4,044 | $61,280 | $11,260 | $50,020 |
| 2015 | $3,993 | $58,180 | $10,690 | $47,490 |
| 2014 | $3,628 | $51,770 | $9,430 | $42,340 |
| 2013 | $3,621 | $52,120 | $9,490 | $42,630 |
Property History
| Date | Event | Price | List to Sale | Price per Sq Ft |
|---|---|---|---|---|
| 11/20/2025 11/20/25 | For Sale | $379,000 | -- | $250 / Sq Ft |
Purchase History
| Date | Type | Sale Price | Title Company |
|---|---|---|---|
| Warranty Deed | $208,000 | Ticor Title Insurance Compan | |
| Warranty Deed | $144,500 | Intercounty Title |
Mortgage History
| Date | Status | Loan Amount | Loan Type |
|---|---|---|---|
| Open | $204,232 | FHA | |
| Previous Owner | $136,606 | FHA |
Source: Midwest Real Estate Data (MRED)
MLS Number: 12516594
APN: 07-04-305-026
Disclaimer: Certain information contained herein is derived from information provided by parties other than Homes.com. All information provided is deemed reliable, but is not guaranteed to be accurate and should be independently verified.
![]() Based on information submitted to the MLS GRID. All data is obtained from various sources and may not have been verified by broker or MLS GRID. Supplied Open House Information is subject to change without notice. All information should be independently reviewed and verified for accuracy. Properties may or may not be listed by the office/agent presenting the information. Some IDX listings have been excluded from this website.
Based on information submitted to the MLS GRID. All data is obtained from various sources and may not have been verified by broker or MLS GRID. Supplied Open House Information is subject to change without notice. All information should be independently reviewed and verified for accuracy. Properties may or may not be listed by the office/agent presenting the information. Some IDX listings have been excluded from this website.
The Digital Millennium Copyright Act of 1998, 17 U.S.C. § 512 (the “DMCA”) provides recourse for copyright owners who believe that material appearing on the Internet infringes their rights under U.S. copyright law. If you believe in good faith that any content or material made available in connection with our website or services infringes your copyright, you (or your agent) may send us a notice requesting that the content or material be removed, or access to it blocked.
Notices must be sent in writing by email to DMCAnotice@MLSGrid.com.
The DMCA requires that your notice of alleged copyright infringement include the following information:
(1) description of the copyrighted work that is the subject of claimed infringement;
(2) description of the alleged infringing content and information sufficient to permit us to locate the content;
(3) contact information for you, including your address, telephone number and email address;
(4) a statement by you that you have a good faith belief that the content in the manner complained of is not authorized by the copyright owner, or its agent, or by the operation of any law;
(5) a statement by you, signed under penalty of perjury, that the information in the notification is accurate and that you have the authority to enforce the copyrights that are claimed to be infringed; and
(6) a physical or electronic signature of the copyright owner or a person authorized to act on the copyright owner’s behalf. Failure to include all of the above information may result in the delay of the processing of your complaint.
- 1640 Hilton Head Dr
- 30W539 Fairway Dr
- 30W289 Pinehurst Dr Unit 289
- 5S353 Stewart Dr
- 4S365 Meadow Rd
- 4S359 Meadow Rd
- 2460 Golf Ridge Cir Unit 2460
- 1804 Alta Vista Ct
- 30W214 Briar Ln
- 2084 Maplewood Cir
- 5S510 Scots Dr Unit G
- 2011 Maplewood Cir
- 4S069 Barclay Rd
- 2911 Dearborn Ct
- 1022 Neudearborn Ln Unit 19-1022
- 920 Charlton Ln Unit 5106
- 912 Bradford Dr
- 1887 Paddington Ave Unit 3
- 2138 Iron Ridge Ln
- 2024 Iron Ridge Ln
- 1598 Fairway Dr
- 1627 Country Lakes Dr
- 2486 Golf Ridge Cir
- 2562 Golf Ridge Cir
- 1575 Bond St
- 970 Fairway Dr
- 2410 Oneida Ln
- 2509 Oneida Ln
- 2418 Oneida Ln
- 835 Genesee Dr
- 2332 Overlook Ct
- 5S510 Scots Dr Unit G
- 805 Genesee Dr
- 810 Woodewind Dr Unit 2
- 1541 Westminster Dr Unit 102
- 1541 Westminster Dr Unit 203
- 1517 Westminster Dr Unit 108
- 1517 Westminster Dr Unit 106
- 1517 Westminster Dr Unit 112
- 1517 Westminster Dr Unit 107