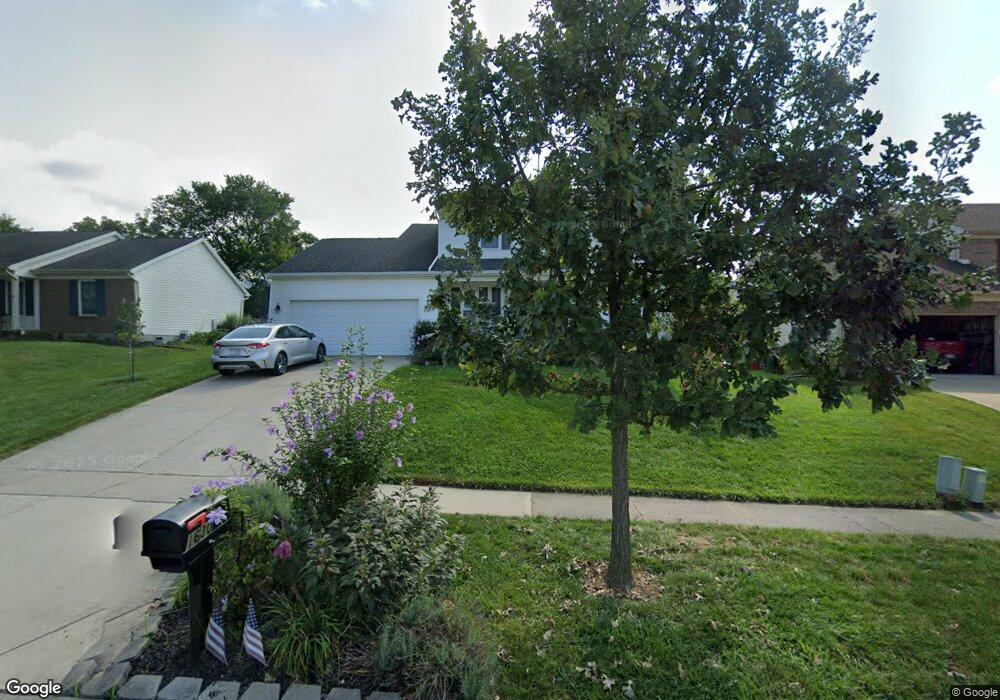
1630 Tollgate Ct Lebanon, OH 45036
Estimated Value: $377,000 - $394,919
4
Beds
3
Baths
2,698
Sq Ft
$143/Sq Ft
Est. Value
About This Home
This home is located at 1630 Tollgate Ct, Lebanon, OH 45036 and is currently estimated at $386,230, approximately $143 per square foot. 1630 Tollgate Ct is a home located in Warren County with nearby schools including Bowman Primary School, Berry Intermediate School, and Donovan Elementary School.
Ownership History
Date
Name
Owned For
Owner Type
Purchase Details
Closed on
Nov 30, 2018
Sold by
Hirko Scott M and Hirko Erin M
Bought by
Mell Suzanne and Mell Jeffrey S
Current Estimated Value
Home Financials for this Owner
Home Financials are based on the most recent Mortgage that was taken out on this home.
Original Mortgage
$197,900
Outstanding Balance
$126,050
Interest Rate
4.8%
Mortgage Type
New Conventional
Estimated Equity
$260,180
Purchase Details
Closed on
May 4, 1995
Sold by
Lauralex Homes Inc
Bought by
Hirko Scott M and Hirko Erin M
Home Financials for this Owner
Home Financials are based on the most recent Mortgage that was taken out on this home.
Original Mortgage
$128,650
Interest Rate
6.5%
Mortgage Type
New Conventional
Purchase Details
Closed on
Nov 4, 1994
Sold by
Wesreal Inc
Bought by
Laurelex Homes Inc
Purchase Details
Closed on
Feb 24, 1994
Sold by
Wesreal & Inc
Bought by
Wesreal & Inc.
Create a Home Valuation Report for This Property
The Home Valuation Report is an in-depth analysis detailing your home's value as well as a comparison with similar homes in the area
Home Values in the Area
Average Home Value in this Area
Purchase History
| Date | Buyer | Sale Price | Title Company |
|---|---|---|---|
| Mell Suzanne | $224,900 | None Available | |
| Hirko Scott M | $135,447 | -- | |
| Laurelex Homes Inc | $22,000 | -- | |
| Wesreal & Inc. | -- | -- |
Source: Public Records
Mortgage History
| Date | Status | Borrower | Loan Amount |
|---|---|---|---|
| Open | Mell Suzanne | $197,900 | |
| Previous Owner | Hirko Scott M | $128,650 |
Source: Public Records
Tax History Compared to Growth
Tax History
| Year | Tax Paid | Tax Assessment Tax Assessment Total Assessment is a certain percentage of the fair market value that is determined by local assessors to be the total taxable value of land and additions on the property. | Land | Improvement |
|---|---|---|---|---|
| 2024 | $4,875 | $109,560 | $28,000 | $81,560 |
| 2023 | $4,275 | $85,162 | $12,915 | $72,247 |
| 2022 | $4,454 | $85,162 | $12,915 | $72,247 |
| 2021 | $4,242 | $85,162 | $12,915 | $72,247 |
| 2020 | $4,109 | $69,237 | $10,500 | $58,737 |
| 2019 | $4,140 | $69,237 | $10,500 | $58,737 |
| 2018 | $3,214 | $69,237 | $10,500 | $58,737 |
| 2017 | $3,214 | $62,118 | $9,982 | $52,136 |
| 2016 | $3,315 | $62,118 | $9,982 | $52,136 |
| 2015 | $3,339 | $62,118 | $9,982 | $52,136 |
| 2014 | $3,162 | $56,470 | $9,080 | $47,400 |
| 2013 | $3,042 | $65,330 | $10,500 | $54,830 |
Source: Public Records
Map
Nearby Homes
- 278 Ludlow Ct
- 1644 Cantebury Ln
- 1130 Silversmith Way
- 243 Birmingham Ct
- 1179 Silversmith Way
- 229 Dickens Ct
- 382 N Church Dr
- 1133 Reveres Run
- 364 Grey's Run
- 376 Grey's Run
- 351 Grey's Run
- 1443 N Broadway St
- 409 Bethpage Way Unit 7-301
- 5 Acres Ave
- 409 Bethpage Way
- 5 Acres Lot D Phillips Rd
- 1 Dryhill Ct
- 908 Hartz Dr
- 2733 N State Route 48
- 2733 Ohio 48
- 1634 Tollgate Ct
- 1626 Tollgate Ct
- 274 Birmingham Ct
- 1638 Tollgate Ct
- 270 Birmingham Ct
- 1631 Tollgate Ct
- 1627 Tollgate Ct
- 1635 Tollgate Ct
- 1642 Tollgate Ct
- 1623 Tollgate Ct
- 1637 Cantebury Ln
- 1618 Tollgate Ct
- 1639 Tollgate Ct
- 1619 Tollgate Ct
- 1641 Cantebury Ln
- 277 Birmingham Ct
- 1646 Tollgate Ct
- 1633 Cantebury Ln
- 1643 Tollgate Ct
- 1136 Silversmith Way