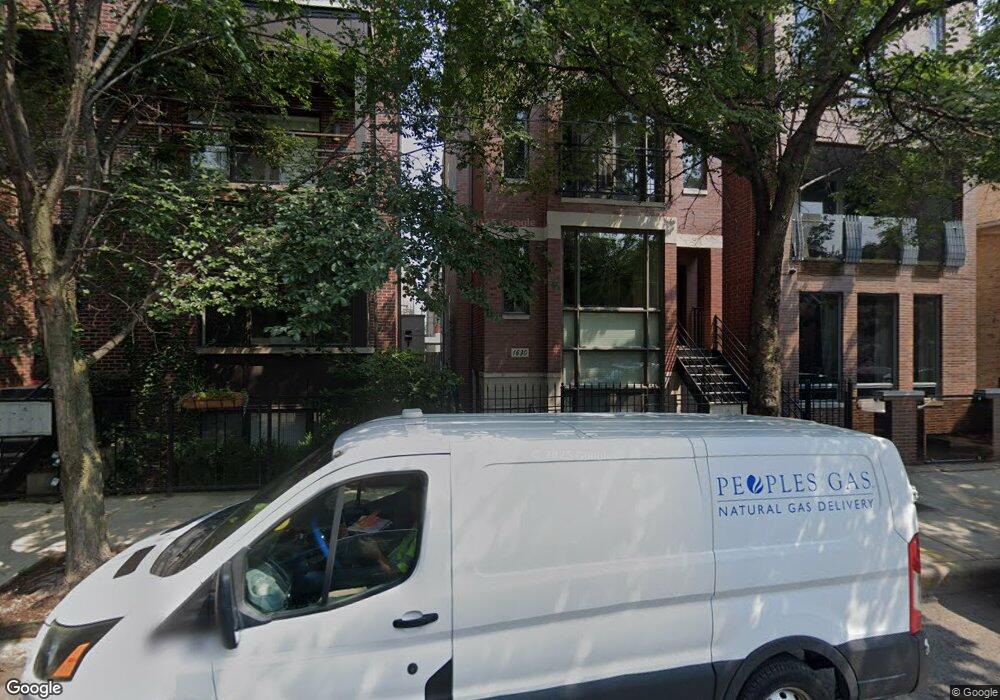
1630 W Julian St Unit 1 Chicago, IL 60622
Wicker Park NeighborhoodEstimated Value: $625,000 - $825,000
3
Beds
3
Baths
5,020
Sq Ft
$143/Sq Ft
Est. Value
About This Home
This home is located at 1630 W Julian St Unit 1, Chicago, IL 60622 and is currently estimated at $719,393, approximately $143 per square foot. 1630 W Julian St Unit 1 is a home located in Cook County with nearby schools including Rodolfo Lozano Bilingual and International Center, Wells Community Academy High School, and Rowe Elementary School.
Ownership History
Date
Name
Owned For
Owner Type
Purchase Details
Closed on
Sep 5, 2012
Sold by
Armstrong Ryan and Armstrong Catherine
Bought by
Armstrong Scott L and Armstrong Nancy L
Current Estimated Value
Home Financials for this Owner
Home Financials are based on the most recent Mortgage that was taken out on this home.
Original Mortgage
$325,000
Outstanding Balance
$224,780
Interest Rate
3.56%
Mortgage Type
Assumption
Estimated Equity
$494,613
Purchase Details
Closed on
Jul 27, 2007
Sold by
Construction Trades Associates Inc
Bought by
Armstrong Ryan and Armstrong Catherine
Home Financials for this Owner
Home Financials are based on the most recent Mortgage that was taken out on this home.
Original Mortgage
$412,500
Interest Rate
6.73%
Mortgage Type
Unknown
Purchase Details
Closed on
Nov 17, 2005
Sold by
Brake Capitola M
Bought by
Construction Trade Associates Inc
Create a Home Valuation Report for This Property
The Home Valuation Report is an in-depth analysis detailing your home's value as well as a comparison with similar homes in the area
Home Values in the Area
Average Home Value in this Area
Purchase History
| Date | Buyer | Sale Price | Title Company |
|---|---|---|---|
| Armstrong Scott L | $550,000 | Fidelity National Title Insu | |
| Armstrong Ryan | $550,000 | Cti | |
| Construction Trade Associates Inc | $400,000 | Cti |
Source: Public Records
Mortgage History
| Date | Status | Borrower | Loan Amount |
|---|---|---|---|
| Open | Armstrong Scott L | $325,000 | |
| Previous Owner | Armstrong Ryan | $412,500 |
Source: Public Records
Tax History Compared to Growth
Tax History
| Year | Tax Paid | Tax Assessment Tax Assessment Total Assessment is a certain percentage of the fair market value that is determined by local assessors to be the total taxable value of land and additions on the property. | Land | Improvement |
|---|---|---|---|---|
| 2024 | $9,598 | $60,974 | $7,282 | $53,692 |
| 2023 | $9,426 | $51,987 | $2,846 | $49,141 |
| 2022 | $9,426 | $51,987 | $2,846 | $49,141 |
| 2021 | $9,248 | $51,985 | $2,845 | $49,140 |
| 2020 | $9,690 | $49,084 | $2,845 | $46,239 |
| 2019 | $8,996 | $50,951 | $2,845 | $48,106 |
| 2018 | $8,843 | $50,951 | $2,845 | $48,106 |
| 2017 | $9,083 | $48,270 | $2,511 | $45,759 |
| 2016 | $8,811 | $48,270 | $2,511 | $45,759 |
| 2015 | $8,151 | $48,978 | $2,511 | $46,467 |
| 2014 | $5,936 | $36,394 | $2,971 | $33,423 |
| 2013 | $6,619 | $36,394 | $2,971 | $33,423 |
Source: Public Records
Map
Nearby Homes
- 1521 N Paulina St Unit 3R
- 1636 W Julian St
- 1455 N Paulina St
- 1624 W Pierce Ave
- 1653 W North Ave
- 1456 N Ashland Ave
- 1721 W Pierce Ave
- 1723 W North Ave Unit 3
- 1723 W North Ave Unit 1
- 1747 W Pierce Ave Unit 2
- 1536 N Bosworth Ave Unit 2S
- 1611 N Hermitage Ave Unit 205
- 1611 N Hermitage Ave Unit 206
- 1611 N Hermitage Ave Unit 301
- 1644 W Blackhawk St Unit 2E
- 1646 W Blackhawk St
- 1355 N Dean St
- 1748 W North Ave
- 1532 N Greenview Ave
- 1703 W Wabansia Ave
- 1630 W Julian St Unit 3
- 1630 W Julian St Unit 2
- 1632 W Julian St Unit 1W
- 1632 W Julian St Unit 1E
- 1632 W Julian St
- 1632 W Julian St Unit 34
- 1632 W Julian St Unit 3E
- 1632 W Julian St Unit 1E
- 1632 W Julian St Unit 1W
- 1632 W Julian St Unit 3W
- 1632 W Julian St Unit 3E
- 1632 W Julian St Unit 1E
- 1628 W Julian St
- 1628 W Julian St Unit 2
- 1628 W Julian St Unit 1
- 1628 W Julian St
- 1634 W Julian St Unit 2
- 1604 W Julian St Unit 2
- 1624 W Julian St
- 1624 W Julian St