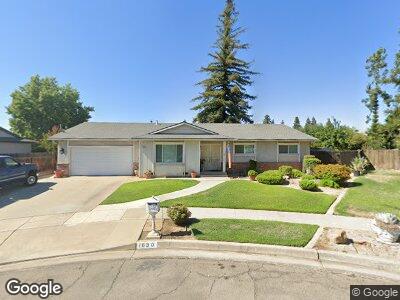
1630 W Los Altos Ave Fresno, CA 93711
Bullard NeighborhoodEstimated Value: $467,878 - $540,000
3
Beds
2
Baths
1,836
Sq Ft
$272/Sq Ft
Est. Value
About This Home
This home is located at 1630 W Los Altos Ave, Fresno, CA 93711 and is currently estimated at $498,970, approximately $271 per square foot. 1630 W Los Altos Ave is a home located in Fresno County with nearby schools including Starr Elementary School, Tenaya Middle School, and Bullard High School.
Ownership History
Date
Name
Owned For
Owner Type
Purchase Details
Closed on
Apr 10, 1997
Sold by
Carlile Douglas E and Carlile Roberta L
Bought by
Stacey Scott A and Stacey Kari A
Current Estimated Value
Home Financials for this Owner
Home Financials are based on the most recent Mortgage that was taken out on this home.
Original Mortgage
$123,500
Interest Rate
7.98%
Mortgage Type
VA
Purchase Details
Closed on
May 6, 1996
Sold by
The Roman Catholic Bishop Of Fresno
Bought by
Carlile Douglas E and Carlile Roberta L
Home Financials for this Owner
Home Financials are based on the most recent Mortgage that was taken out on this home.
Original Mortgage
$24,500
Interest Rate
7.8%
Mortgage Type
Seller Take Back
Purchase Details
Closed on
Oct 7, 1993
Sold by
Carlile Douglas E and Carlile Roberta L
Bought by
Carlile Douglas E and Carlile Roberta L
Create a Home Valuation Report for This Property
The Home Valuation Report is an in-depth analysis detailing your home's value as well as a comparison with similar homes in the area
Home Values in the Area
Average Home Value in this Area
Purchase History
| Date | Buyer | Sale Price | Title Company |
|---|---|---|---|
| Stacey Scott A | $123,500 | Fidelity National Title Co | |
| Carlile Douglas E | $49,500 | Chicago Title Co | |
| Carlile Douglas E | -- | -- |
Source: Public Records
Mortgage History
| Date | Status | Borrower | Loan Amount |
|---|---|---|---|
| Open | Stacey Scott A | $123,000 | |
| Closed | Stacey Scott A | $123,500 | |
| Previous Owner | Carlile Douglas E | $24,500 |
Source: Public Records
Tax History Compared to Growth
Tax History
| Year | Tax Paid | Tax Assessment Tax Assessment Total Assessment is a certain percentage of the fair market value that is determined by local assessors to be the total taxable value of land and additions on the property. | Land | Improvement |
|---|---|---|---|---|
| 2023 | $2,476 | $193,308 | $62,603 | $130,705 |
| 2022 | $2,442 | $189,519 | $61,376 | $128,143 |
| 2021 | $2,375 | $185,804 | $60,173 | $125,631 |
| 2020 | $2,365 | $183,899 | $59,556 | $124,343 |
| 2019 | $2,274 | $180,294 | $58,389 | $121,905 |
| 2018 | $2,225 | $176,760 | $57,245 | $119,515 |
| 2017 | $2,187 | $173,295 | $56,123 | $117,172 |
| 2016 | $2,115 | $169,898 | $55,023 | $114,875 |
| 2015 | $2,083 | $167,347 | $54,197 | $113,150 |
| 2014 | $2,129 | $164,070 | $53,136 | $110,934 |
Source: Public Records
Map
Nearby Homes
- 6569 N Teilman Ave
- 1487 W Paul Ave
- 6602 N West Ave
- 1352 W Menlo Ave
- 1646 W Millbrae Ave
- 1715 W Tenaya Way
- 1731 W Tenaya Way
- 1316 W Palo Alto Ave
- 6458 N Warren Ave
- 7015 N Teilman Ave Unit 102
- 1590 W Escalon Ave
- 7093 N Teilman Ave Unit 102
- 1387 W Sample Ave
- 1547 W Fir Ave
- 1517 W Fir Ave
- 6665 N Farris Ave
- 7178 N Fruit Ave Unit 115
- 7178 N Fruit Ave Unit 132
- 7166 N Fruit Ave
- 7166 N Fruit Ave Unit 187
- 1630 W Los Altos Ave
- 1624 W Los Altos Ave
- 1623 W Palo Alto Ave
- 1638 W Los Altos Ave
- 1639 W Palo Alto Ave
- 1607 W Palo Alto Ave
- 1652 W Los Altos Ave
- 1623 W Los Altos Ave
- 6555 N Teilman Ave
- 1655 W Palo Alto Ave
- 1629 W Los Altos Ave
- 1637 W Los Altos Ave
- 6531 N Teilman Ave
- 1651 W Los Altos Ave
- 1620 W Palo Alto Ave
- 1666 W Los Altos Ave
- 1632 W Palo Alto Ave
- 1606 W Palo Alto Ave
- 1667 W Palo Alto Ave
- 1628 W Paul Ave