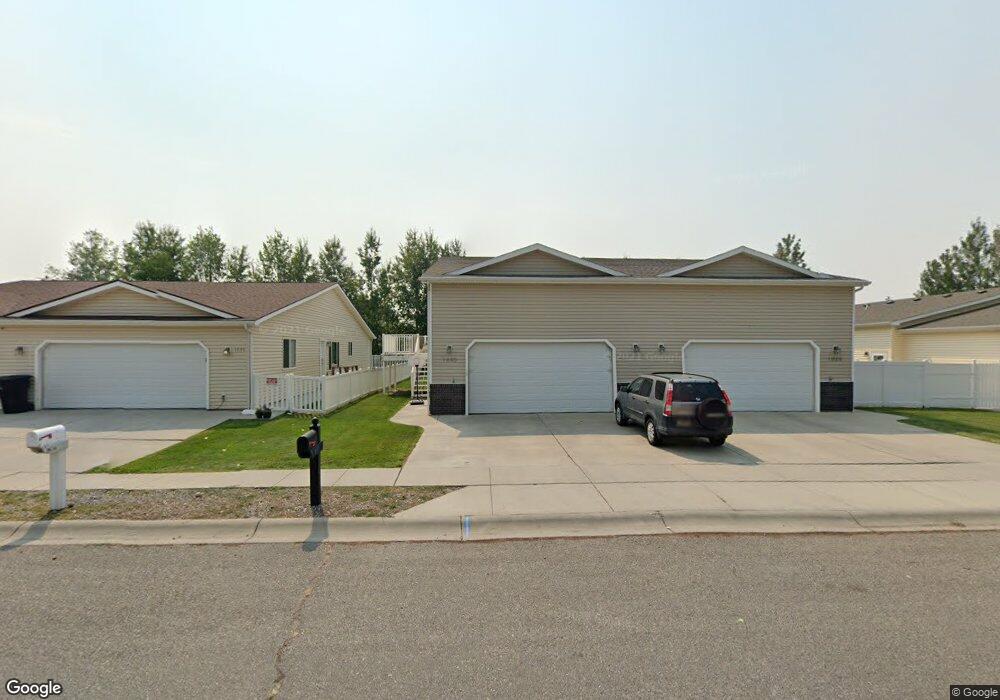
1630 Wicks Ln Billings, MT 59105
Billings Heights NeighborhoodEstimated Value: $283,000 - $299,990
4
Beds
2
Baths
960
Sq Ft
$307/Sq Ft
Est. Value
About This Home
This home is located at 1630 Wicks Ln, Billings, MT 59105 and is currently estimated at $294,248, approximately $306 per square foot. 1630 Wicks Ln is a home located in Yellowstone County with nearby schools including Beartooth School, Medicine Crow Middle School, and Skyview High School.
Ownership History
Date
Name
Owned For
Owner Type
Purchase Details
Closed on
Aug 31, 2009
Sold by
Peregoy Jason E and Peregoy Holly Jo
Bought by
Wilson Mark D
Current Estimated Value
Home Financials for this Owner
Home Financials are based on the most recent Mortgage that was taken out on this home.
Original Mortgage
$109,125
Interest Rate
5.09%
Mortgage Type
New Conventional
Purchase Details
Closed on
Jul 14, 2006
Sold by
Jensen Kaam and Luhman Naysa
Bought by
Peregoy Jason E and Peregoy Holly
Home Financials for this Owner
Home Financials are based on the most recent Mortgage that was taken out on this home.
Original Mortgage
$160,011
Interest Rate
6.57%
Mortgage Type
VA
Purchase Details
Closed on
Sep 14, 2005
Sold by
Detienne Lloyd
Bought by
Jensen Kaam and Luhman Naysa
Home Financials for this Owner
Home Financials are based on the most recent Mortgage that was taken out on this home.
Original Mortgage
$137,655
Interest Rate
5.76%
Mortgage Type
New Conventional
Create a Home Valuation Report for This Property
The Home Valuation Report is an in-depth analysis detailing your home's value as well as a comparison with similar homes in the area
Home Values in the Area
Average Home Value in this Area
Purchase History
| Date | Buyer | Sale Price | Title Company |
|---|---|---|---|
| Wilson Mark D | -- | St | |
| Peregoy Jason E | -- | None Available | |
| Jensen Kaam | -- | None Available |
Source: Public Records
Mortgage History
| Date | Status | Borrower | Loan Amount |
|---|---|---|---|
| Closed | Wilson Mark D | $109,125 | |
| Previous Owner | Peregoy Jason E | $160,011 | |
| Previous Owner | Jensen Kaam | $137,655 |
Source: Public Records
Tax History Compared to Growth
Tax History
| Year | Tax Paid | Tax Assessment Tax Assessment Total Assessment is a certain percentage of the fair market value that is determined by local assessors to be the total taxable value of land and additions on the property. | Land | Improvement |
|---|---|---|---|---|
| 2025 | $2,356 | $284,900 | $23,868 | $261,032 |
| 2024 | $2,356 | $246,800 | $13,774 | $233,026 |
| 2023 | $2,377 | $246,800 | $13,774 | $233,026 |
| 2022 | $1,905 | $201,800 | $0 | $0 |
| 2021 | $2,131 | $201,800 | $0 | $0 |
| 2020 | $2,170 | $201,500 | $0 | $0 |
| 2019 | $2,070 | $201,500 | $0 | $0 |
| 2018 | $1,916 | $182,400 | $0 | $0 |
| 2017 | $1,861 | $182,400 | $0 | $0 |
| 2016 | $1,708 | $168,700 | $0 | $0 |
| 2015 | $1,670 | $168,700 | $0 | $0 |
| 2014 | $1,532 | $82,097 | $0 | $0 |
Source: Public Records
Map
Nearby Homes
- 1727 Wicks Ln
- 10 Attika St N
- 6 N Bing
- 13 Hartland St N
- 1402 Emma Ave
- 4 Lapin St
- 8 Lapin St
- 1 Rainier St N
- 1261 Cherry Island Dr
- 1982 Sandra Dr
- 1290 Cherry Island Dr
- 1327 Tania Cir
- 1819 Natalie St
- 38 Danube St
- 1212 Cherry Island Dr
- 1518 S Ping Cir
- 1961 Bitterroot Dr
- 1252 Timbers Blvd
- 1243 Steffanich Dr
- 1332 Hawthorne Ln
- 1628 Wicks Ln
- 1636 Wicks Ln
- 1638 Wicks Ln
- 1622 Wicks Ln
- 1548 Wicks Ln
- 1620 Wicks Ln
- 1640 Moose Hollow Rd Unit T
- 1640 Moose Hollow Ln
- 1644 Wicks Ln
- 1641 Moose Hollow Rd
- 1638 Moose Hollow Ln
- 1641 Moose Hollow Ln
- 1641 Moose Hollow Ln
- 1646 Wicks Ln
- 1602 Moose Hollow Rd
- 1616 Wicks Ln
- 1646 Moose Hollow Ln
- 1647 Moose Hollow Rd
- 1634 Moose Hollow Rd
- 1652 Moose Hollow Rd