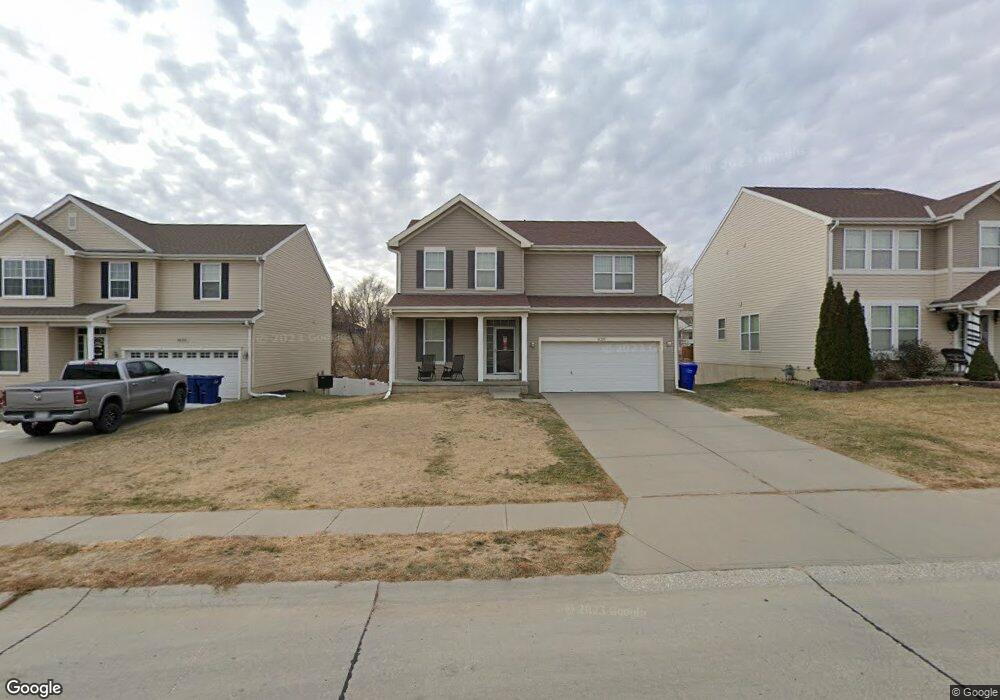
16305 Loop St Omaha, NE 68136
Southwest Omaha NeighborhoodEstimated Value: $339,929 - $377,000
3
Beds
3
Baths
2,263
Sq Ft
$159/Sq Ft
Est. Value
About This Home
This home is located at 16305 Loop St, Omaha, NE 68136 and is currently estimated at $359,982, approximately $159 per square foot. 16305 Loop St is a home located in Sarpy County with nearby schools including Upchurch Elementary School, Millard South High School, and Harry Andersen Middle School.
Ownership History
Date
Name
Owned For
Owner Type
Purchase Details
Closed on
Mar 8, 2011
Sold by
Smith Scott M and Smith Amy B
Bought by
Barker Amber J and Barker Russell
Current Estimated Value
Home Financials for this Owner
Home Financials are based on the most recent Mortgage that was taken out on this home.
Original Mortgage
$162,766
Outstanding Balance
$112,257
Interest Rate
4.87%
Mortgage Type
FHA
Estimated Equity
$247,725
Purchase Details
Closed on
Feb 16, 2010
Sold by
Smith Scott M and Smith Amy B
Bought by
Smith Scott M and Smith Amy B
Home Financials for this Owner
Home Financials are based on the most recent Mortgage that was taken out on this home.
Original Mortgage
$142,100
Interest Rate
5.05%
Purchase Details
Closed on
Dec 26, 2007
Sold by
Hearthstone Homes Inc
Bought by
Smith Scott M and Guice Amy B
Home Financials for this Owner
Home Financials are based on the most recent Mortgage that was taken out on this home.
Original Mortgage
$165,563
Interest Rate
6.26%
Mortgage Type
Small Business Administration
Create a Home Valuation Report for This Property
The Home Valuation Report is an in-depth analysis detailing your home's value as well as a comparison with similar homes in the area
Home Values in the Area
Average Home Value in this Area
Purchase History
| Date | Buyer | Sale Price | Title Company |
|---|---|---|---|
| Barker Amber J | $167,000 | Nlta | |
| Smith Scott M | -- | Mrt | |
| Smith Scott M | $166,000 | Fat |
Source: Public Records
Mortgage History
| Date | Status | Borrower | Loan Amount |
|---|---|---|---|
| Open | Barker Amber J | $162,766 | |
| Previous Owner | Smith Scott M | $142,100 | |
| Previous Owner | Smith Scott M | $165,563 |
Source: Public Records
Tax History
| Year | Tax Paid | Tax Assessment Tax Assessment Total Assessment is a certain percentage of the fair market value that is determined by local assessors to be the total taxable value of land and additions on the property. | Land | Improvement |
|---|---|---|---|---|
| 2025 | $5,317 | $316,169 | $60,000 | $256,169 |
| 2024 | $5,673 | $305,328 | $58,000 | $247,328 |
| 2023 | $5,673 | $271,008 | $49,000 | $222,008 |
| 2022 | $5,423 | $238,104 | $41,000 | $197,104 |
| 2021 | $5,160 | $219,486 | $41,000 | $178,486 |
| 2020 | $5,084 | $213,962 | $41,000 | $172,962 |
| 2019 | $4,937 | $203,941 | $41,000 | $162,941 |
| 2018 | $4,779 | $190,084 | $35,000 | $155,084 |
| 2017 | $4,808 | $186,314 | $35,000 | $151,314 |
| 2016 | $4,705 | $177,933 | $35,000 | $142,933 |
| 2015 | $4,530 | $169,207 | $35,000 | $134,207 |
| 2014 | $4,542 | $167,388 | $35,000 | $132,388 |
| 2012 | -- | $162,676 | $35,000 | $127,676 |
Source: Public Records
Map
Nearby Homes
- 8711 S 169th St
- 17010 Centennial Rd
- 16750 Chutney Dr
- 17013 Centennial Rd
- 16812 Colony Cir
- 8352 S 169th St
- 17222 Musket St
- TBD Redwood St
- Lot 143 Garden Oaks
- 16111 Birch Ave
- 9406 S 173rd St
- 16121 Blackwalnut St
- 17212 Chutney Dr
- 10030 S 162nd St
- 9930 S 172nd Cir
- 7730 S 161st Terrace
- 8308 S 175th St
- 17610 Musket St
- 17525 Rose Lane Rd
- 8359 S 176th Cir
- 16309 Loop St
- 16301 Loop St
- 16313 Loop St
- 8828 S 163rd Ave
- 16317 Loop St
- 8831 S 163rd Ave
- 8823 S 164th St
- 8824 S 163rd Ave
- 16403 Loop St
- 8827 S 163rd Ave
- 8819 S 164th St
- 8820 S 163rd Ave
- 8920 S 163rd St
- 16407 Loop St
- 8823 S 163rd Ave
- 8823 S 163rd Ave
- 8916 S 163rd St
- 16527 Loop St
- 16542 Loop St
- 8815 S 164th St
Your Personal Tour Guide
Ask me questions while you tour the home.