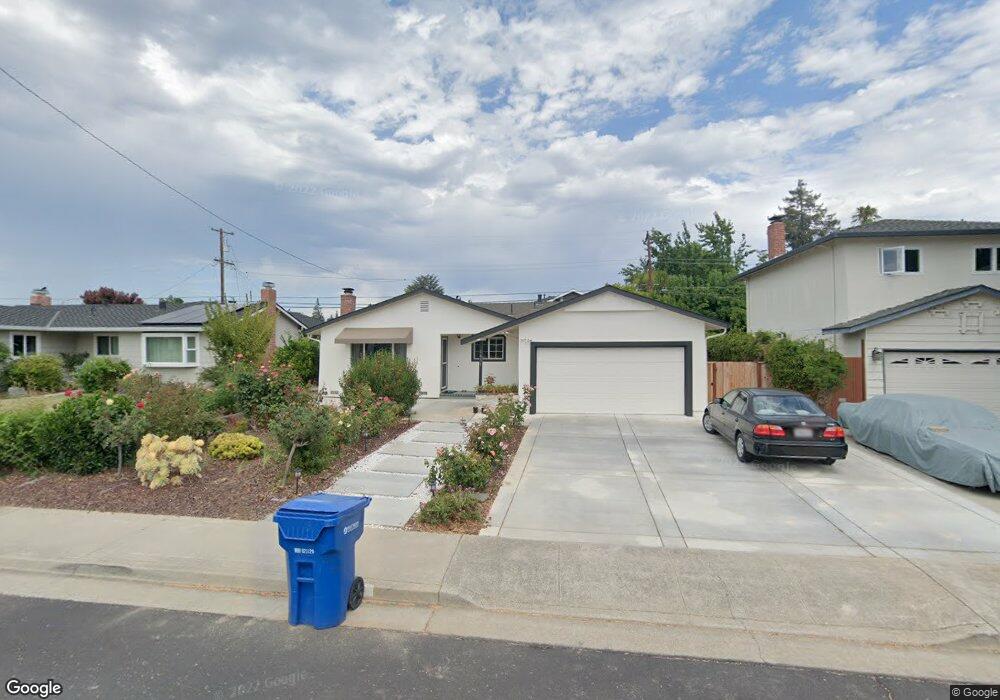
1631 Villarita Dr Campbell, CA 95008
Hathaway NeighborhoodEstimated Value: $1,676,000 - $2,069,000
3
Beds
2
Baths
1,372
Sq Ft
$1,385/Sq Ft
Est. Value
About This Home
This home is located at 1631 Villarita Dr, Campbell, CA 95008 and is currently estimated at $1,900,668, approximately $1,385 per square foot. 1631 Villarita Dr is a home located in Santa Clara County with nearby schools including Latimer Elementary School, Moreland Middle School, and Prospect High School.
Ownership History
Date
Name
Owned For
Owner Type
Purchase Details
Closed on
Dec 15, 2020
Sold by
Jain Rahul and Jain Archana Rameshwar
Bought by
Jain Rahul and Jain Archana Rameshwar
Current Estimated Value
Purchase Details
Closed on
May 14, 2001
Sold by
Gill Patricia M
Bought by
Jain Rahul and Jain Archana R
Home Financials for this Owner
Home Financials are based on the most recent Mortgage that was taken out on this home.
Original Mortgage
$400,000
Outstanding Balance
$147,589
Interest Rate
6.87%
Estimated Equity
$1,753,079
Purchase Details
Closed on
Aug 27, 1998
Sold by
Gill Patricia M
Bought by
Gill Patricia M
Purchase Details
Closed on
Feb 8, 1995
Sold by
Drukarev Alexander I and Drukarev Loraine C
Bought by
Gill Patricia M
Home Financials for this Owner
Home Financials are based on the most recent Mortgage that was taken out on this home.
Original Mortgage
$191,000
Interest Rate
9.27%
Create a Home Valuation Report for This Property
The Home Valuation Report is an in-depth analysis detailing your home's value as well as a comparison with similar homes in the area
Home Values in the Area
Average Home Value in this Area
Purchase History
| Date | Buyer | Sale Price | Title Company |
|---|---|---|---|
| Jain Rahul | -- | None Available | |
| Jain Rahul | $510,000 | First American Title Guarant | |
| Gill Patricia M | -- | -- | |
| Gill Patricia M | $241,000 | All Cal Title Company |
Source: Public Records
Mortgage History
| Date | Status | Borrower | Loan Amount |
|---|---|---|---|
| Open | Jain Rahul | $400,000 | |
| Previous Owner | Gill Patricia M | $191,000 | |
| Closed | Jain Rahul | $59,000 |
Source: Public Records
Tax History Compared to Growth
Tax History
| Year | Tax Paid | Tax Assessment Tax Assessment Total Assessment is a certain percentage of the fair market value that is determined by local assessors to be the total taxable value of land and additions on the property. | Land | Improvement |
|---|---|---|---|---|
| 2025 | $10,413 | $768,468 | $345,809 | $422,659 |
| 2024 | $10,413 | $753,401 | $339,029 | $414,372 |
| 2023 | $10,413 | $738,630 | $332,382 | $406,248 |
| 2022 | $10,189 | $724,148 | $325,865 | $398,283 |
| 2021 | $10,011 | $709,950 | $319,476 | $390,474 |
| 2020 | $9,802 | $702,672 | $316,201 | $386,471 |
| 2019 | $9,426 | $688,895 | $310,001 | $378,894 |
| 2018 | $9,163 | $675,388 | $303,923 | $371,465 |
| 2017 | $9,031 | $662,146 | $297,964 | $364,182 |
| 2016 | $8,515 | $649,164 | $292,122 | $357,042 |
| 2015 | $8,415 | $639,414 | $287,735 | $351,679 |
| 2014 | $8,183 | $626,890 | $282,099 | $344,791 |
Source: Public Records
Map
Nearby Homes
- 1918 Castro Dr
- 1797 W Campbell Ave
- 115 Superior Dr
- 1607 Duvall Dr
- 146 English Rose Cir
- 1803 Bucknall Rd
- 2025 Woodglen Dr
- 1815 Bucknall Rd
- 4406 Norwich Way
- 84 Lavonne Dr
- 4599 Tilbury Dr
- 4497 Latimer Ave
- 2090 Elmgrove Ln
- 1957 Colusa Way
- 990 Gale Dr
- 5043 Le Miccine Terrace Unit 76
- 1370 Saratoga Ave
- 3816 Phoenix Ct
- 1364 Saratoga Ave
- 2303 Camrose Ave
- 1643 Villarita Dr
- 1615 Villarita Dr
- 1676 Ensenada Dr
- 1655 Villarita Dr
- 1601 Villarita Dr
- 1690 Ensenada Dr
- 1664 Ensenada Dr
- 1620 Villarita Dr
- 1704 Ensenada Dr
- 1652 Ensenada Dr
- 1636 Villarita Dr
- 1604 Villarita Dr
- 1667 Villarita Dr
- 1591 Villarita Dr
- 1650 Villarita Dr
- 1586 Villarita Dr
- 1716 Ensenada Dr
- 1638 Ensenada Dr
- 125 Calado Ave
- 1664 Villarita Dr