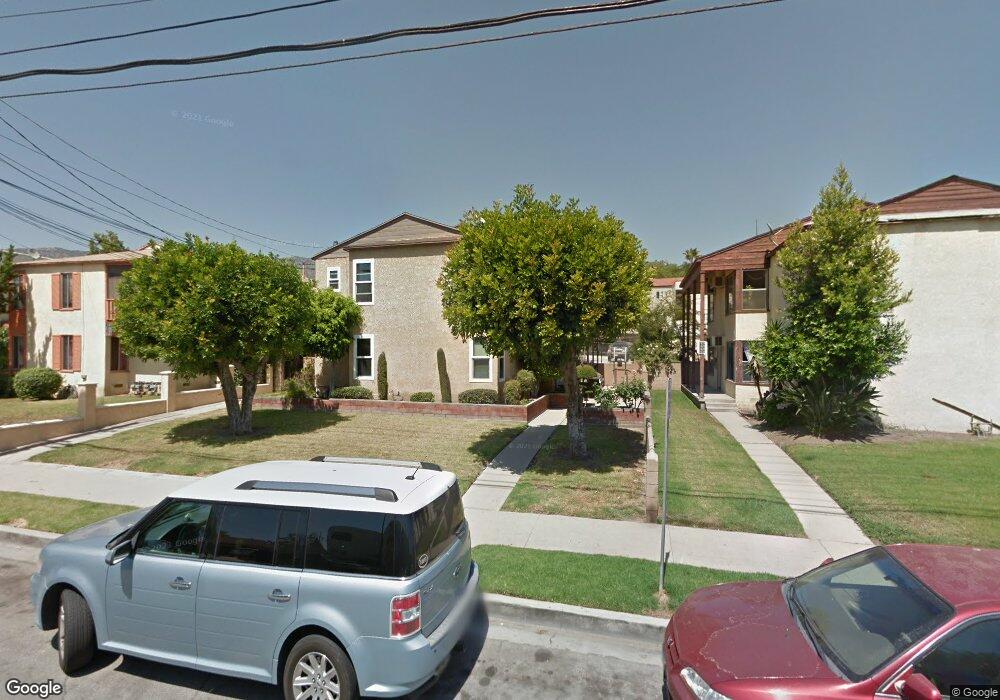
1632 Scott Rd Burbank, CA 91504
Hillside District NeighborhoodEstimated Value: $1,528,000 - $1,596,000
8
Beds
4
Baths
3,136
Sq Ft
$495/Sq Ft
Est. Value
About This Home
This home is located at 1632 Scott Rd, Burbank, CA 91504 and is currently estimated at $1,551,000, approximately $494 per square foot. 1632 Scott Rd is a home located in Los Angeles County with nearby schools including Thomas Jefferson Elementary School, John Muir Middle School, and Burbank High School.
Ownership History
Date
Name
Owned For
Owner Type
Purchase Details
Closed on
May 10, 2003
Sold by
Stearns Lori
Bought by
Stearns Timothy John
Current Estimated Value
Home Financials for this Owner
Home Financials are based on the most recent Mortgage that was taken out on this home.
Original Mortgage
$296,000
Outstanding Balance
$128,460
Interest Rate
5.77%
Mortgage Type
Purchase Money Mortgage
Estimated Equity
$1,422,540
Purchase Details
Closed on
May 3, 2000
Sold by
Stearns Ronald John and Stearns Janet Marie
Bought by
Stearns Ronald John
Purchase Details
Closed on
Dec 28, 1994
Sold by
Haase Margaret
Bought by
Stearns Timothy John
Purchase Details
Closed on
Jul 19, 1994
Sold by
Davidson Dave and Davidson Heather
Bought by
Haase Margaret
Purchase Details
Closed on
Mar 8, 1994
Sold by
Stearns Ronald and Stearns Janet
Bought by
Stearns Ronald
Create a Home Valuation Report for This Property
The Home Valuation Report is an in-depth analysis detailing your home's value as well as a comparison with similar homes in the area
Home Values in the Area
Average Home Value in this Area
Purchase History
| Date | Buyer | Sale Price | Title Company |
|---|---|---|---|
| Stearns Timothy John | -- | Act | |
| Stearns Ronald John | -- | -- | |
| Stearns Timothy John | -- | Gateway Title | |
| Haase Margaret | -- | -- | |
| Stearns Ronald | -- | -- |
Source: Public Records
Mortgage History
| Date | Status | Borrower | Loan Amount |
|---|---|---|---|
| Open | Stearns Timothy John | $296,000 |
Source: Public Records
Tax History
| Year | Tax Paid | Tax Assessment Tax Assessment Total Assessment is a certain percentage of the fair market value that is determined by local assessors to be the total taxable value of land and additions on the property. | Land | Improvement |
|---|---|---|---|---|
| 2025 | $6,954 | $604,837 | $304,817 | $300,020 |
| 2024 | $6,954 | $592,979 | $298,841 | $294,138 |
| 2023 | $6,883 | $581,353 | $292,982 | $288,371 |
| 2022 | $6,580 | $569,955 | $287,238 | $282,717 |
| 2021 | $6,540 | $558,780 | $281,606 | $277,174 |
| 2019 | $6,283 | $542,207 | $273,254 | $268,953 |
| 2018 | $6,149 | $531,577 | $267,897 | $263,680 |
| 2016 | $5,819 | $510,938 | $257,496 | $253,442 |
| 2015 | $5,704 | $503,265 | $253,629 | $249,636 |
| 2014 | $5,712 | $493,407 | $248,661 | $244,746 |
Source: Public Records
Map
Nearby Homes
- 1711 Grismer Ave Unit 72
- 1814 Grismer Ave
- 1515 Grismer Ave Unit 302
- 501 Birmingham Rd
- 505 Cambridge Dr
- 441 Dartmouth Rd
- 1719 Landis St
- 1113 N Glenoaks Blvd
- 1901 Peyton Ave Unit N
- 2014 Peyton Ave
- 1304 N Griffith Park Dr
- 1924 N Parish Place
- 227 E Burbank Blvd Unit C
- 637 E Fairmount Rd
- 1331 N Lamer St
- 2316 N Parish Place
- 831 E Walnut Ave
- 2109 N Lincoln St
- 701 N 6th St
- 1138 N Parish Place
- 1624 Scott Rd
- 1642 Scott Rd
- 1616 Scott Rd
- 1706 Scott Rd Unit 1706
- 1608 Scott Rd
- 1605 Scott Rd Unit 108
- 1600 Scott Rd
- 1603 Scott Rd Unit 107
- 1625 Scott Rd
- 301 Birmingham Rd
- 1601 Scott Rd Unit 113
- 1601 Scott Rd Unit 101
- 1601 Scott Rd
- 315 Birmingham Rd Unit 315
- 309 Birmingham Rd
- 317 Birmingham Rd
- 1701 Scott Rd Unit 201
- 1701 Scott Rd Unit 202
- 1701 Scott Rd Unit 203
- 1701 Scott Rd Unit 204
Your Personal Tour Guide
Ask me questions while you tour the home.