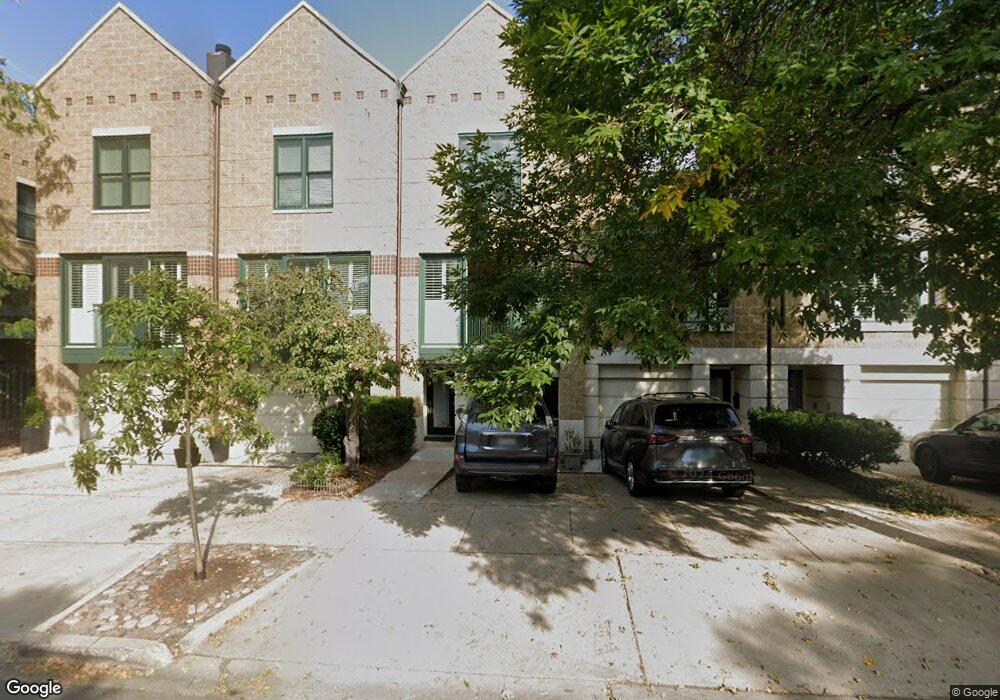
1633 N Larrabee St Unit A Chicago, IL 60614
Old Town NeighborhoodEstimated Value: $1,704,000 - $1,879,657
4
Beds
4
Baths
4,182
Sq Ft
$422/Sq Ft
Est. Value
About This Home
This home is located at 1633 N Larrabee St Unit A, Chicago, IL 60614 and is currently estimated at $1,764,552, approximately $421 per square foot. 1633 N Larrabee St Unit A is a home located in Cook County with nearby schools including Abraham Lincoln Elementary School, Lincoln Park High School, and The Noble Academy.
Ownership History
Date
Name
Owned For
Owner Type
Purchase Details
Closed on
Jul 16, 2007
Sold by
Cambata Shahrookh R and Cambata Carole A
Bought by
Malaisrie Sukit Christopher and Malaisrie Montaya N
Current Estimated Value
Home Financials for this Owner
Home Financials are based on the most recent Mortgage that was taken out on this home.
Original Mortgage
$1,000,000
Outstanding Balance
$625,033
Interest Rate
6.5%
Mortgage Type
Unknown
Estimated Equity
$1,139,519
Purchase Details
Closed on
Sep 15, 1993
Sold by
Lasalle National Trust Na
Bought by
Cambata Shahrookh R and Cambata Carole A
Home Financials for this Owner
Home Financials are based on the most recent Mortgage that was taken out on this home.
Original Mortgage
$420,000
Interest Rate
7.15%
Create a Home Valuation Report for This Property
The Home Valuation Report is an in-depth analysis detailing your home's value as well as a comparison with similar homes in the area
Home Values in the Area
Average Home Value in this Area
Purchase History
| Date | Buyer | Sale Price | Title Company |
|---|---|---|---|
| Malaisrie Sukit Christopher | $1,353,000 | None Available | |
| Cambata Shahrookh R | $350,000 | -- |
Source: Public Records
Mortgage History
| Date | Status | Borrower | Loan Amount |
|---|---|---|---|
| Open | Malaisrie Sukit Christopher | $1,000,000 | |
| Previous Owner | Cambata Shahrookh R | $420,000 |
Source: Public Records
Tax History Compared to Growth
Tax History
| Year | Tax Paid | Tax Assessment Tax Assessment Total Assessment is a certain percentage of the fair market value that is determined by local assessors to be the total taxable value of land and additions on the property. | Land | Improvement |
|---|---|---|---|---|
| 2024 | $29,753 | $140,437 | $48,538 | $91,899 |
| 2023 | $28,983 | $144,333 | $39,144 | $105,189 |
| 2022 | $28,983 | $144,333 | $39,144 | $105,189 |
| 2021 | $28,354 | $144,332 | $39,143 | $105,189 |
| 2020 | $25,455 | $117,367 | $34,446 | $82,921 |
| 2019 | $24,921 | $127,470 | $34,446 | $93,024 |
| 2018 | $24,501 | $127,470 | $34,446 | $93,024 |
| 2017 | $25,866 | $123,532 | $28,183 | $95,349 |
| 2016 | $24,242 | $123,532 | $28,183 | $95,349 |
| 2015 | $22,156 | $123,532 | $28,183 | $95,349 |
| 2014 | $20,411 | $112,576 | $21,137 | $91,439 |
| 2013 | $19,997 | $112,576 | $21,137 | $91,439 |
Source: Public Records
Map
Nearby Homes
- 557 W Eugenie St Unit 557
- 1623 N Mohawk St
- 1648 N Cleveland Ave
- 1626 N Larrabee St
- 1715 N Larrabee St Unit 1S
- 1720 N Mohawk St
- 1733 N Mohawk St Unit 3N
- 1733 N Larrabee St
- 437 W North Ave Unit 404
- 505 W Menomonee St
- 1646 N Orchard St Unit PHS
- 1646 N Orchard St Unit 2
- 1523 N Cleveland Ave Unit 2S
- 1630 N Sedgwick St Unit 2
- 1714 N Sedgwick St
- 1547 N Hudson Ave Unit 1
- 1543 N Hudson Ave Unit 2
- 1503 N Mohawk St Unit 2E
- 1529 N Hudson Ave Unit 1
- 1637 N Burling St
- 1633 N Larrabee St Unit 1633A
- 1627 N Larrabee St Unit 1627
- 1635 N Larrabee St Unit 1635C
- 1635 N Larrabee St Unit 1635B
- 1635 N Larrabee St Unit 1635F
- 1635 N Larrabee St Unit 1635A
- 1635 N Larrabee St Unit 1635D
- 1635 N Larrabee St Unit 1635E
- 1635 N Larrabee St Unit E
- 1635 N Larrabee St Unit C
- 1630 N Mohawk St Unit 1630
- 1628 N Mohawk St Unit 1628
- 1625 N Larrabee St Unit 1641
- 1625 N Larrabee St Unit 1637A
- 1625 N Larrabee St Unit 1617
- 1625 N Larrabee St Unit 1607B
- 1625 N Larrabee St Unit 1610A
- 1625 N Larrabee St Unit 1633B
- 1625 N Larrabee St Unit 1625
- 1625 N Larrabee St