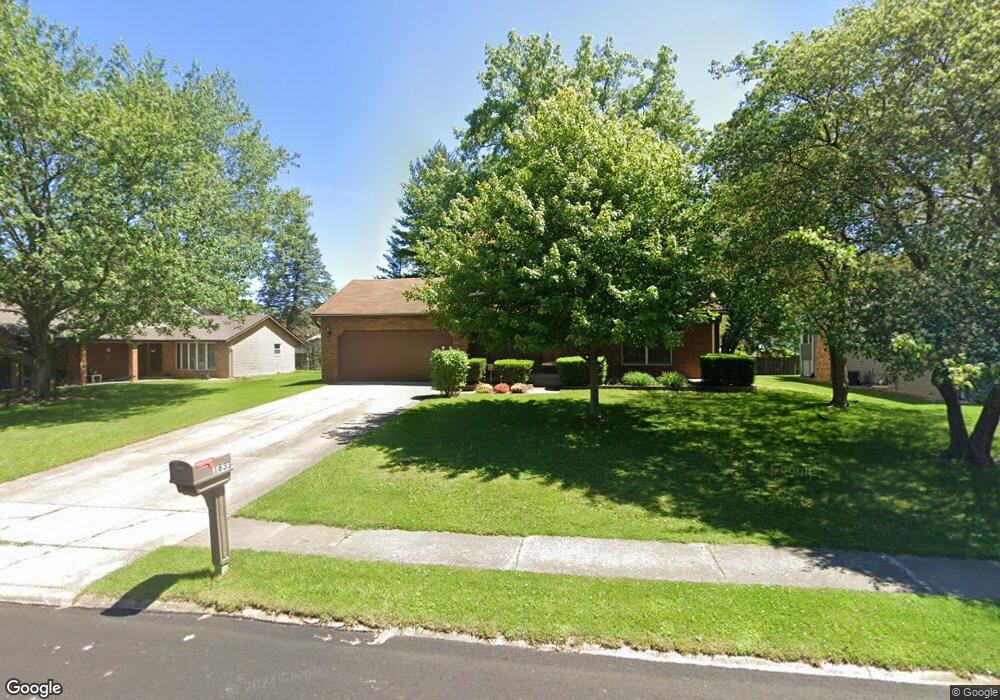
1633 Partridge Way Chesterton, IN 46304
Estimated Value: $300,157 - $342,000
4
Beds
3
Baths
1,662
Sq Ft
$191/Sq Ft
Est. Value
About This Home
This home is located at 1633 Partridge Way, Chesterton, IN 46304 and is currently estimated at $317,789, approximately $191 per square foot. 1633 Partridge Way is a home located in Porter County with nearby schools including Bailly Elementary School, Westchester Intermediate School, and Chesterton Middle School.
Ownership History
Date
Name
Owned For
Owner Type
Purchase Details
Closed on
Nov 24, 2009
Sold by
Lams Nathan E and Lams Erin D
Bought by
Keller Carl L
Current Estimated Value
Home Financials for this Owner
Home Financials are based on the most recent Mortgage that was taken out on this home.
Original Mortgage
$183,612
Outstanding Balance
$121,047
Interest Rate
5.11%
Mortgage Type
FHA
Estimated Equity
$196,742
Purchase Details
Closed on
Aug 31, 2006
Sold by
Harrison Susan E
Bought by
Lams Nathan E and Lams Erin D
Home Financials for this Owner
Home Financials are based on the most recent Mortgage that was taken out on this home.
Original Mortgage
$142,000
Interest Rate
6.7%
Mortgage Type
Purchase Money Mortgage
Purchase Details
Closed on
May 19, 2005
Sold by
Harrison Robert J and Harrison Susan E
Bought by
Harrison Susan E
Create a Home Valuation Report for This Property
The Home Valuation Report is an in-depth analysis detailing your home's value as well as a comparison with similar homes in the area
Home Values in the Area
Average Home Value in this Area
Purchase History
| Date | Buyer | Sale Price | Title Company |
|---|---|---|---|
| Keller Carl L | -- | Meridian Title Corp | |
| Lams Nathan E | -- | Ticor Title Insurance | |
| Harrison Susan E | -- | -- |
Source: Public Records
Mortgage History
| Date | Status | Borrower | Loan Amount |
|---|---|---|---|
| Open | Keller Carl L | $183,612 | |
| Previous Owner | Lams Nathan E | $142,000 |
Source: Public Records
Tax History Compared to Growth
Tax History
| Year | Tax Paid | Tax Assessment Tax Assessment Total Assessment is a certain percentage of the fair market value that is determined by local assessors to be the total taxable value of land and additions on the property. | Land | Improvement |
|---|---|---|---|---|
| 2024 | $2,968 | $265,100 | $44,900 | $220,200 |
| 2023 | $2,948 | $265,200 | $41,400 | $223,800 |
| 2022 | $2,668 | $240,300 | $41,400 | $198,900 |
| 2021 | $2,395 | $214,900 | $41,400 | $173,500 |
| 2020 | $2,335 | $209,600 | $36,100 | $173,500 |
| 2019 | $2,061 | $185,500 | $36,100 | $149,400 |
| 2018 | $2,052 | $182,800 | $36,100 | $146,700 |
| 2017 | $1,986 | $181,500 | $36,100 | $145,400 |
| 2016 | $1,847 | $177,600 | $40,000 | $137,600 |
| 2014 | $1,856 | $167,200 | $37,900 | $129,300 |
| 2013 | -- | $161,100 | $38,100 | $123,000 |
Source: Public Records
Map
Nearby Homes
- 1609 S 5th St
- 542 Dunewood Dr
- 1730 S 11th St
- 123 Beverly Dr
- 604 Oakwood Dr
- 1874 Catkin Cir
- 0 W 1050 N
- 701 S Park Dr
- 225 Jefferson Ave
- 422 Jefferson Ave
- 1038 N Meridian Rd
- 2034 Texas St
- 522 S Calumet Rd
- 525 S Calumet Rd
- 1949 David Dr
- 1032 Preserve Ln
- 1978 Laura Ln
- 2132 Pradera Trail
- 1005 Preserve Ln
- 1012 N Meridian Rd
- 1625 Partridge Way
- 1641 Partridge Way
- 1700 Green Meadow Ln
- 1700 Green Ln
- 1624 Green Meadow Ln
- 1617 Partridge Way
- 1708 Green Ln
- 1708 Green Meadow Ln
- 1632 Partridge Way
- 1616 Green Meadow Ln
- 1624 Partridge Way
- 1640 Partridge Way
- 1716 Green Meadow Ln
- 1609 Partridge Way
- 1616 Partridge Way
- 1608 Green Ln
- 1608 Green Meadow Ln
- 1724 Green Ln
- 1724 Green Meadow Ln
- 1657 Partridge Way