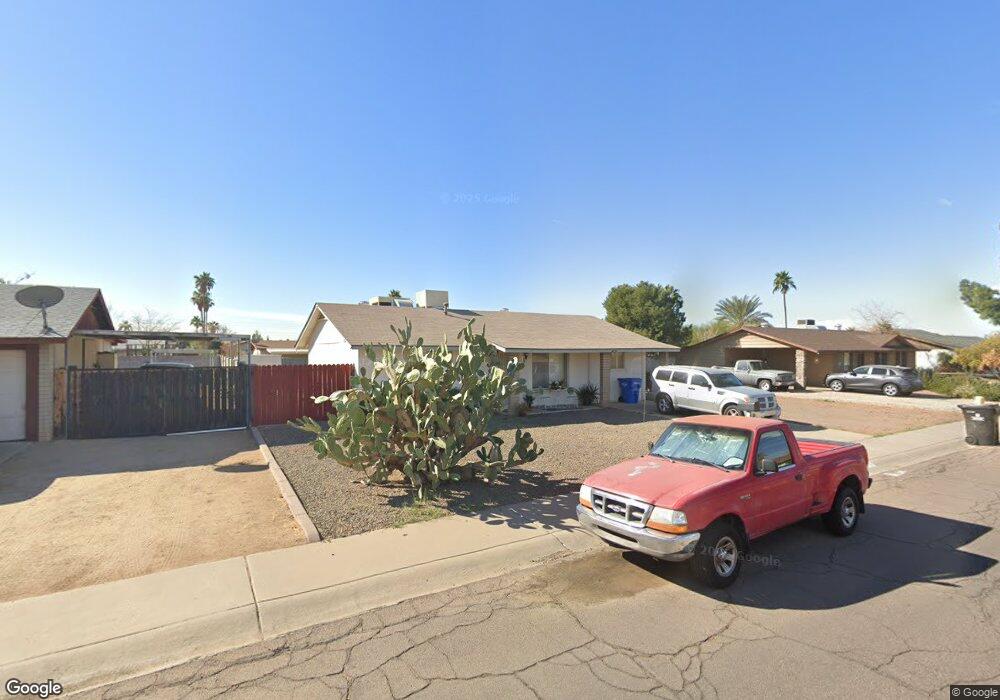
1633 W Michelle Dr Phoenix, AZ 85023
North Central Phoenix NeighborhoodEstimated Value: $238,073 - $348,000
3
Beds
1
Bath
1,084
Sq Ft
$279/Sq Ft
Est. Value
About This Home
This home is located at 1633 W Michelle Dr, Phoenix, AZ 85023 and is currently estimated at $302,768, approximately $279 per square foot. 1633 W Michelle Dr is a home located in Maricopa County with nearby schools including Constitution Elementary School, Deer Valley Middle School, and Barry Goldwater High School.
Ownership History
Date
Name
Owned For
Owner Type
Purchase Details
Closed on
Jun 2, 2004
Sold by
Stevenson Kim
Bought by
Conceicao Angela
Current Estimated Value
Home Financials for this Owner
Home Financials are based on the most recent Mortgage that was taken out on this home.
Original Mortgage
$108,000
Outstanding Balance
$48,757
Interest Rate
4.87%
Mortgage Type
New Conventional
Estimated Equity
$254,011
Purchase Details
Closed on
Oct 5, 2001
Sold by
Bong Matthew A
Bought by
Stevenson Kim
Home Financials for this Owner
Home Financials are based on the most recent Mortgage that was taken out on this home.
Original Mortgage
$82,450
Interest Rate
6.9%
Purchase Details
Closed on
Aug 15, 1995
Sold by
Youngs Sterling Edward
Bought by
Bong Matthew A
Home Financials for this Owner
Home Financials are based on the most recent Mortgage that was taken out on this home.
Original Mortgage
$51,891
Interest Rate
7.88%
Mortgage Type
FHA
Create a Home Valuation Report for This Property
The Home Valuation Report is an in-depth analysis detailing your home's value as well as a comparison with similar homes in the area
Home Values in the Area
Average Home Value in this Area
Purchase History
| Date | Buyer | Sale Price | Title Company |
|---|---|---|---|
| Conceicao Angela | $108,000 | Security Title Agency | |
| Stevenson Kim | $85,000 | First American Title | |
| Bong Matthew A | $52,000 | United Title Agency |
Source: Public Records
Mortgage History
| Date | Status | Borrower | Loan Amount |
|---|---|---|---|
| Open | Conceicao Angela | $108,000 | |
| Previous Owner | Stevenson Kim | $82,450 | |
| Previous Owner | Bong Matthew A | $51,891 |
Source: Public Records
Tax History Compared to Growth
Tax History
| Year | Tax Paid | Tax Assessment Tax Assessment Total Assessment is a certain percentage of the fair market value that is determined by local assessors to be the total taxable value of land and additions on the property. | Land | Improvement |
|---|---|---|---|---|
| 2025 | $748 | $8,688 | -- | -- |
| 2024 | $735 | $8,275 | -- | -- |
| 2023 | $735 | $21,910 | $4,380 | $17,530 |
| 2022 | $708 | $16,770 | $3,350 | $13,420 |
| 2021 | $739 | $15,330 | $3,060 | $12,270 |
| 2020 | $726 | $13,660 | $2,730 | $10,930 |
| 2019 | $703 | $12,020 | $2,400 | $9,620 |
| 2018 | $679 | $10,420 | $2,080 | $8,340 |
| 2017 | $656 | $8,510 | $1,700 | $6,810 |
| 2016 | $619 | $8,850 | $1,770 | $7,080 |
| 2015 | $552 | $7,910 | $1,580 | $6,330 |
Source: Public Records
Map
Nearby Homes
- 1702 W Michelle Dr Unit 1
- 1634 W Villa Rita Dr Unit 2
- 1628 W Bluefield Ave
- 1501 W Grovers Ave
- 1415 W Michigan Ave
- 17614 N 16th Ave
- 17627 N 14th Ave
- 1916 W Morningside Dr Unit 113
- 1916 W Morningside Dr Unit 108
- 17242 N 16th Dr Unit 6
- 17241 N 16th Dr Unit 1
- 1531 W Campo Bello Dr
- 1607 W Rockwood Dr
- 1526 W Hartford Ave
- 18046 N 20th Ave
- 1120 W Wagoner Rd
- 18045 N 20th Ln
- 1615 W Morrow Dr
- 1427 W Anderson Dr
- 1018 W Helena Dr
- 1627 W Michelle Dr
- 1639 W Michelle Dr
- 1634 W Charleston Ave
- 1628 W Charleston Ave
- 1634 W Michelle Dr
- 1621 W Michelle Dr
- 1647 W Michelle Dr
- 1628 W Michelle Dr Unit 2
- 1640 W Michelle Dr
- 1622 W Charleston Ave
- 1648 W Charleston Ave
- 1622 W Michelle Dr
- 1648 W Michelle Dr
- 1633 W Villa Rita Dr
- 1633 W Charleston Ave
- 1616 W Charleston Ave
- 1627 W Villa Rita Dr
- 1639 W Charleston Ave
- 1639 W Villa Rita Dr
- 1627 W Charleston Ave