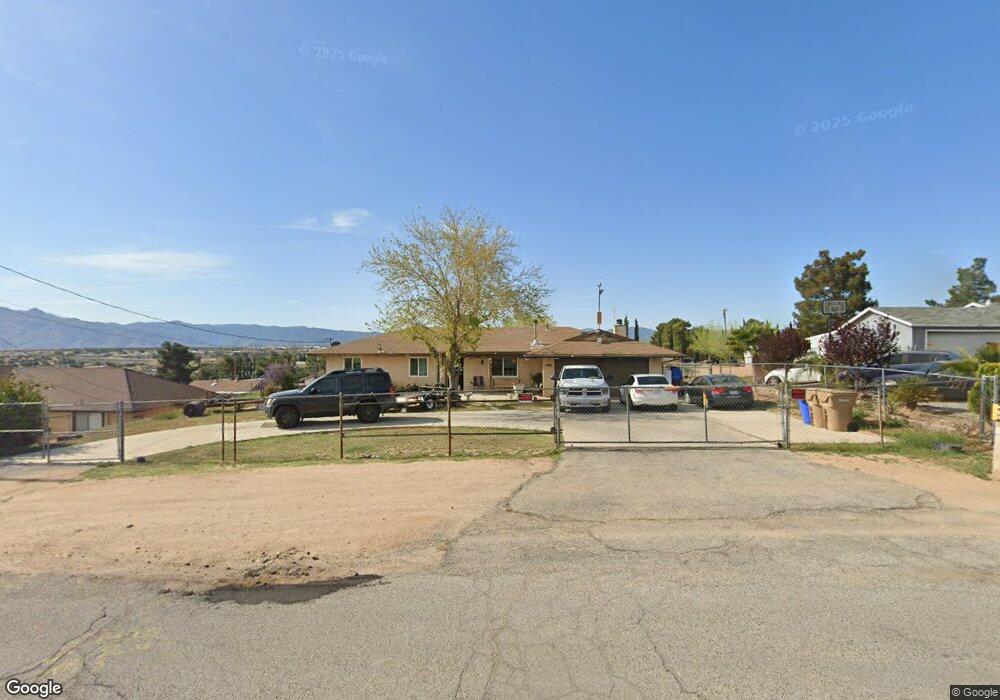
16331 Fremontia St Hesperia, CA 92345
The Mesa NeighborhoodEstimated Value: $415,058 - $456,000
3
Beds
2
Baths
1,512
Sq Ft
$286/Sq Ft
Est. Value
About This Home
This home is located at 16331 Fremontia St, Hesperia, CA 92345 and is currently estimated at $431,765, approximately $285 per square foot. 16331 Fremontia St is a home located in San Bernardino County with nearby schools including Lime Street Elementary School, Ranchero Middle School, and Sultana High School.
Ownership History
Date
Name
Owned For
Owner Type
Purchase Details
Closed on
Mar 7, 2008
Sold by
Lasalle Bank Na
Bought by
Ortiz Melvin N and Ortiz Shirley
Current Estimated Value
Home Financials for this Owner
Home Financials are based on the most recent Mortgage that was taken out on this home.
Original Mortgage
$151,620
Interest Rate
5.99%
Mortgage Type
FHA
Purchase Details
Closed on
Jan 4, 2008
Sold by
Porrero Raymond and Porrero Cindy
Bought by
Lasalle Bank Na and Mlmi Trust Series 2006-Rm1
Purchase Details
Closed on
Dec 8, 2005
Sold by
Porrero Raymond and Porrero Cindy
Bought by
Porrero Raymond and Porrero Cindy
Home Financials for this Owner
Home Financials are based on the most recent Mortgage that was taken out on this home.
Original Mortgage
$270,000
Interest Rate
7.4%
Mortgage Type
Purchase Money Mortgage
Create a Home Valuation Report for This Property
The Home Valuation Report is an in-depth analysis detailing your home's value as well as a comparison with similar homes in the area
Home Values in the Area
Average Home Value in this Area
Purchase History
| Date | Buyer | Sale Price | Title Company |
|---|---|---|---|
| Ortiz Melvin N | $154,000 | Lsi | |
| Lasalle Bank Na | $167,499 | Fnt | |
| Porrero Raymond | -- | Stewart Title Co Anaheim |
Source: Public Records
Mortgage History
| Date | Status | Borrower | Loan Amount |
|---|---|---|---|
| Previous Owner | Ortiz Melvin N | $151,620 | |
| Previous Owner | Porrero Raymond | $270,000 |
Source: Public Records
Tax History Compared to Growth
Tax History
| Year | Tax Paid | Tax Assessment Tax Assessment Total Assessment is a certain percentage of the fair market value that is determined by local assessors to be the total taxable value of land and additions on the property. | Land | Improvement |
|---|---|---|---|---|
| 2025 | $4,032 | $202,281 | $45,971 | $156,310 |
| 2024 | $4,032 | $198,315 | $45,070 | $153,245 |
| 2023 | $4,007 | $194,426 | $44,186 | $150,240 |
| 2022 | $3,957 | $190,614 | $43,320 | $147,294 |
| 2021 | $3,918 | $186,877 | $42,471 | $144,406 |
| 2020 | $3,893 | $184,961 | $42,036 | $142,925 |
| 2019 | $3,850 | $181,335 | $41,212 | $140,123 |
| 2018 | $3,811 | $177,779 | $40,404 | $137,375 |
| 2017 | $3,736 | $174,293 | $39,612 | $134,681 |
| 2016 | $1,869 | $170,875 | $38,835 | $132,040 |
| 2015 | $1,845 | $168,309 | $38,252 | $130,057 |
| 2014 | $1,758 | $160,000 | $32,000 | $128,000 |
Source: Public Records
Map
Nearby Homes
- 16336 Adelia St
- 7847 3rd Ave
- 16347 El Centro St
- 16520 Adelia St
- 7795 E Ave
- 16212 Mesquite St
- 16680 Mission St
- 16230 Rodeo St
- 15971 Mission St
- 16725 Mission St
- 16506 Cactus St
- 16739 Mission St
- 8263 3rd Ave
- 16650 Cactus St
- 15994 Cactus St
- 7548 Chase Ave
- 15900 Mesquite St
- 7390 Chase Ave
- 15845 Mesquite St
- 16662 Joshua St
- 16321 Fremontia St
- 16361 Fremontia St
- 16330 Fir St
- 16344 Fir St
- 16311 Fremontia St
- 16340 Fremontia St
- 16350 Fremontia St
- 16360 Fir St
- 16320 Fremontia St
- 16296 Fir St
- 16389 Fremontia St
- 16370 Fremontia St
- 16380 Fir St
- 16380 Fremontia St
- 16401 Fremontia St
- 16325 Fir St
- 16349 Mission St
- 16396 Fir St
- 16345 Mission St
- 16307 Fir St