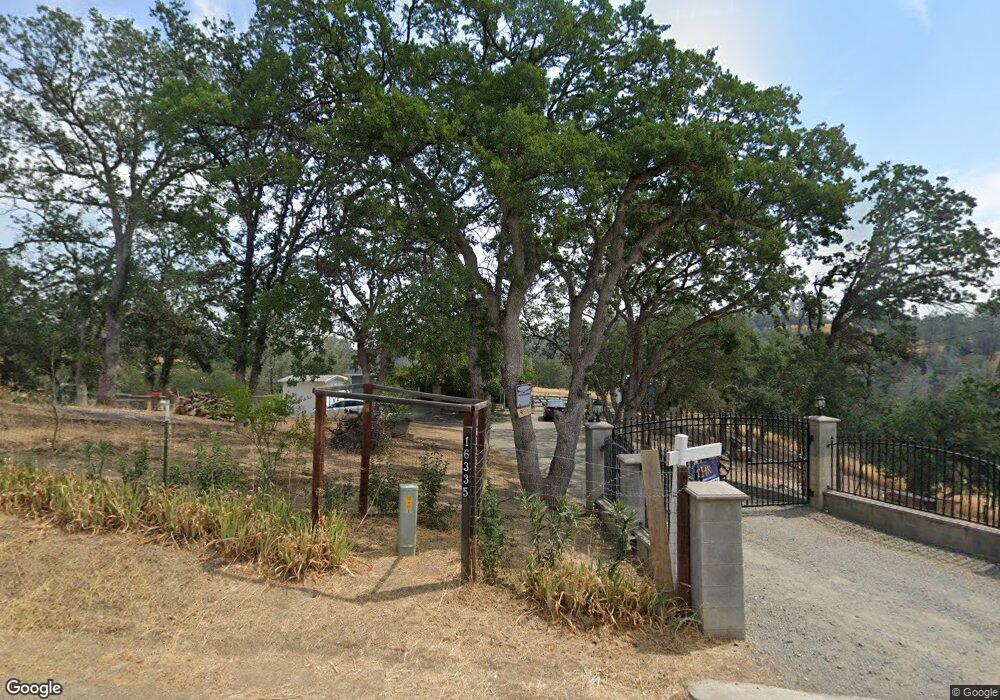
16335 Oakridge Rd Corning, CA 96021
Estimated Value: $60,000 - $131,000
2
Beds
2
Baths
1,152
Sq Ft
$88/Sq Ft
Est. Value
About This Home
This home is located at 16335 Oakridge Rd, Corning, CA 96021 and is currently estimated at $101,808, approximately $88 per square foot. 16335 Oakridge Rd is a home located in Tehama County with nearby schools including Rancho Tehama Elementary School, Maywood Middle School, and Corning High School.
Ownership History
Date
Name
Owned For
Owner Type
Purchase Details
Closed on
Nov 13, 2025
Sold by
Sanchez Miguel Angel Moreno
Bought by
Sanchez Oscar Moreno
Current Estimated Value
Purchase Details
Closed on
Jun 9, 2023
Sold by
Sanchez Oscar Moreno
Bought by
Sanchez Miguel Angel Moreno
Purchase Details
Closed on
Mar 26, 2020
Sold by
Cervantes Susanna
Bought by
Sanchez Oscar Moreno
Purchase Details
Closed on
May 7, 2019
Sold by
Cervantes Susanna
Bought by
Sanchez Oscar Moreno
Purchase Details
Closed on
Apr 6, 2015
Sold by
Moreno Sanchez Jorge A
Bought by
Cervantes Susanna
Purchase Details
Closed on
Oct 29, 2012
Sold by
Laureno Joseph A and Laureno Judith A
Bought by
Sanchez Jorge A Moreno
Purchase Details
Closed on
Jun 5, 2003
Sold by
The Cit Group/Sales Financing Inc
Bought by
Laureno Joseph A and Laureno Judith A
Purchase Details
Closed on
May 25, 2002
Sold by
Mcintosh Francis A and Mcintosh Betty J
Bought by
The Cit Group/Sales Financing Inc
Create a Home Valuation Report for This Property
The Home Valuation Report is an in-depth analysis detailing your home's value as well as a comparison with similar homes in the area
Purchase History
| Date | Buyer | Sale Price | Title Company |
|---|---|---|---|
| Sanchez Oscar Moreno | -- | None Listed On Document | |
| Sanchez Miguel Angel Moreno | -- | None Listed On Document | |
| Sanchez Oscar Moreno | $40,000 | None Available | |
| Sanchez Oscar Moreno | -- | None Available | |
| Cervantes Susanna | -- | None Available | |
| Sanchez Jorge A Moreno | $25,000 | Placer Title Company | |
| Laureno Joseph A | $32,500 | Fidelity National Title | |
| The Cit Group/Sales Financing Inc | $32,000 | Chicago Title Co |
Source: Public Records
Tax History
| Year | Tax Paid | Tax Assessment Tax Assessment Total Assessment is a certain percentage of the fair market value that is determined by local assessors to be the total taxable value of land and additions on the property. | Land | Improvement |
|---|---|---|---|---|
| 2025 | $666 | $62,424 | $26,010 | $36,414 |
| 2023 | $465 | $42,046 | $26,279 | $15,767 |
| 2022 | $457 | $41,222 | $25,764 | $15,458 |
| 2021 | $440 | $40,414 | $25,259 | $15,155 |
| 2020 | $553 | $50,272 | $27,471 | $22,801 |
| 2019 | $531 | $49,287 | $26,933 | $22,354 |
| 2018 | $531 | $48,321 | $26,405 | $21,916 |
| 2017 | $527 | $47,375 | $25,888 | $21,487 |
| 2016 | $492 | $46,447 | $25,381 | $21,066 |
| 2015 | -- | $37,493 | $15,369 | $22,124 |
| 2014 | $267 | $24,159 | $15,068 | $9,091 |
Source: Public Records
Map
Nearby Homes
- 17327 Stagecoach Rd
- 16370 Oakridge Rd
- 16495 Hillcrest Dr Unit Lot 1269
- 16495 Hillcrest Dr
- 16405 Hillcrest Dr
- 16475 Oakridge Rd
- 16475 Oakridge Rd Unit Lot 865
- 16318 Longhorn Ln
- 16080 Oakridge Rd
- 16220 Rancho Tehama Rd
- 7285 Bluebird Rd
- 7285 Bluebird Rd Unit Lot 978
- 6917 Earpe Ct
- 6989 Horseshoe Dr
- 00 Horseshoe Dr
- 7114 Horseshoe Dr
- 16305 Hillcrest Dr
- 16295 Hillcrest Dr
- 16380 Hillcrest Dr
- 16380 Hillcrest Dr Unit Lot 1104
- 7263 Sparrow Ct
- 7258 Sparrow Ct
- 16291 Stagecoach Rd
- 16422 Stagecoach Rd Unit Lot 1006
- 16422 Stagecoach Rd
- 16320 Oakridge Rd
- 16387 Stagecoach Rd Unit Lot 1010
- 16387 Stagecoach Rd
- 16367 Stagecoach Rd
- 16397 Stagecoach Rd
- 16320 Oakridge Rd
- 16347 Stagecoach Rd
- 16407 Stagecoach Rd
- 16360 Oakridge Rd
- 16432 Stagecoach Rd
- 16417 Stagecoach Rd
- 7283 Hawk Ct
- 16450 Hill Crest Rd
- 16447 Stagecoach Rd Unit Lot 1050
- 16447 Stagecoach Rd
Your Personal Tour Guide
Ask me questions while you tour the home.