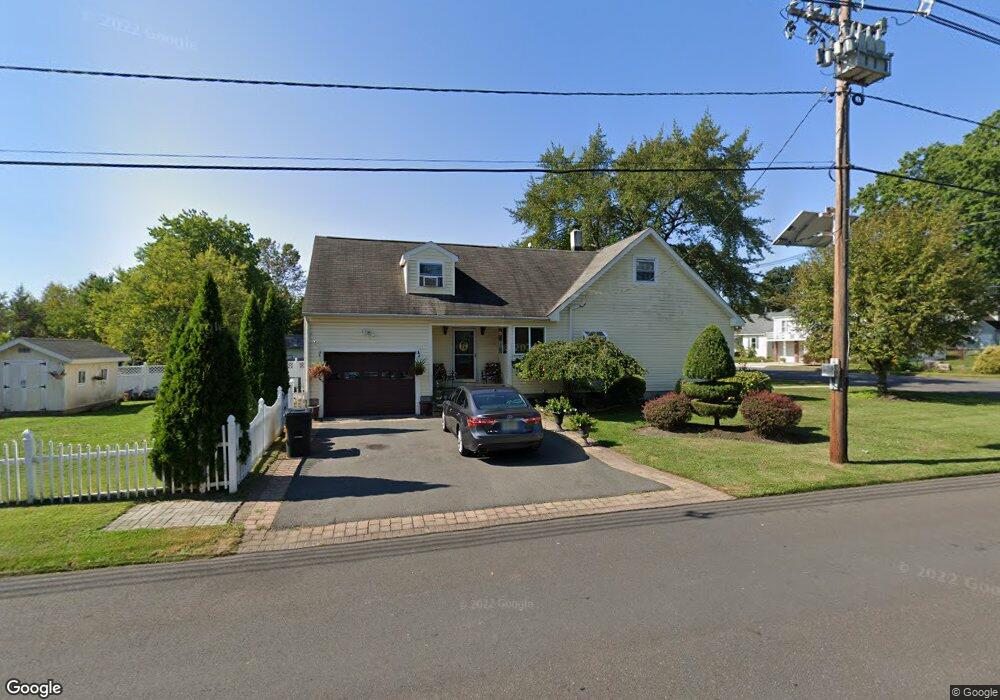
1634 6th St Ewing, NJ 08638
Prospect NeighborhoodEstimated Value: $352,000 - $508,000
--
Bed
--
Bath
2,162
Sq Ft
$199/Sq Ft
Est. Value
About This Home
This home is located at 1634 6th St, Ewing, NJ 08638 and is currently estimated at $429,995, approximately $198 per square foot. 1634 6th St is a home located in Mercer County with nearby schools including Ewing High School, Paul Robeson Charter School For The Humanities, and Trenton Stem-To-Civics Charter School.
Ownership History
Date
Name
Owned For
Owner Type
Purchase Details
Closed on
Nov 24, 1999
Sold by
Brower Kenneth
Bought by
Hayban Dilip
Current Estimated Value
Home Financials for this Owner
Home Financials are based on the most recent Mortgage that was taken out on this home.
Original Mortgage
$92,800
Outstanding Balance
$28,374
Interest Rate
7.77%
Estimated Equity
$401,621
Purchase Details
Closed on
Aug 26, 1994
Sold by
Swanhart Eugene
Bought by
Brower Kenneth M and Hirstein Beth M
Home Financials for this Owner
Home Financials are based on the most recent Mortgage that was taken out on this home.
Original Mortgage
$111,000
Interest Rate
8.44%
Mortgage Type
FHA
Create a Home Valuation Report for This Property
The Home Valuation Report is an in-depth analysis detailing your home's value as well as a comparison with similar homes in the area
Home Values in the Area
Average Home Value in this Area
Purchase History
| Date | Buyer | Sale Price | Title Company |
|---|---|---|---|
| Hayban Dilip | $116,000 | -- | |
| Brower Kenneth M | $111,000 | -- |
Source: Public Records
Mortgage History
| Date | Status | Borrower | Loan Amount |
|---|---|---|---|
| Open | Hayban Dilip | $92,800 | |
| Previous Owner | Brower Kenneth M | $111,000 |
Source: Public Records
Tax History Compared to Growth
Tax History
| Year | Tax Paid | Tax Assessment Tax Assessment Total Assessment is a certain percentage of the fair market value that is determined by local assessors to be the total taxable value of land and additions on the property. | Land | Improvement |
|---|---|---|---|---|
| 2025 | $8,067 | $205,100 | $48,600 | $156,500 |
| 2024 | $7,583 | $205,100 | $48,600 | $156,500 |
| 2023 | $7,583 | $205,100 | $48,600 | $156,500 |
| 2022 | $7,377 | $205,100 | $48,600 | $156,500 |
| 2021 | $7,197 | $205,100 | $48,600 | $156,500 |
| 2020 | $7,094 | $205,100 | $48,600 | $156,500 |
| 2019 | $6,910 | $205,100 | $48,600 | $156,500 |
| 2018 | $7,368 | $139,500 | $32,000 | $107,500 |
| 2017 | $7,540 | $139,500 | $32,000 | $107,500 |
| 2016 | $7,438 | $139,500 | $32,000 | $107,500 |
| 2015 | $7,339 | $139,500 | $32,000 | $107,500 |
| 2014 | $7,320 | $139,500 | $32,000 | $107,500 |
Source: Public Records
Map
Nearby Homes
- 1729 5th St
- 1635 Ninth St
- 16 Shelburne Dr
- 56 Shelburne Dr
- 2 & 4 J Russel Smith Rd
- 12 J Russel Smith Rd
- 50 Hillman Ave
- 17 Hillman Ave
- 341 Stokes Ave
- 40 J Russel Smith Rd
- 19 Hardwick Dr
- 9 Auburn Ave
- 14 Chesney Ave
- 56 Sherbrooke Rd
- 7 Mabel St
- 221 Hazelhurst Ave
- 91 Groveland Ave
- 0 Dryden Ave
- 41 Poland St
- 83 Helen Ave