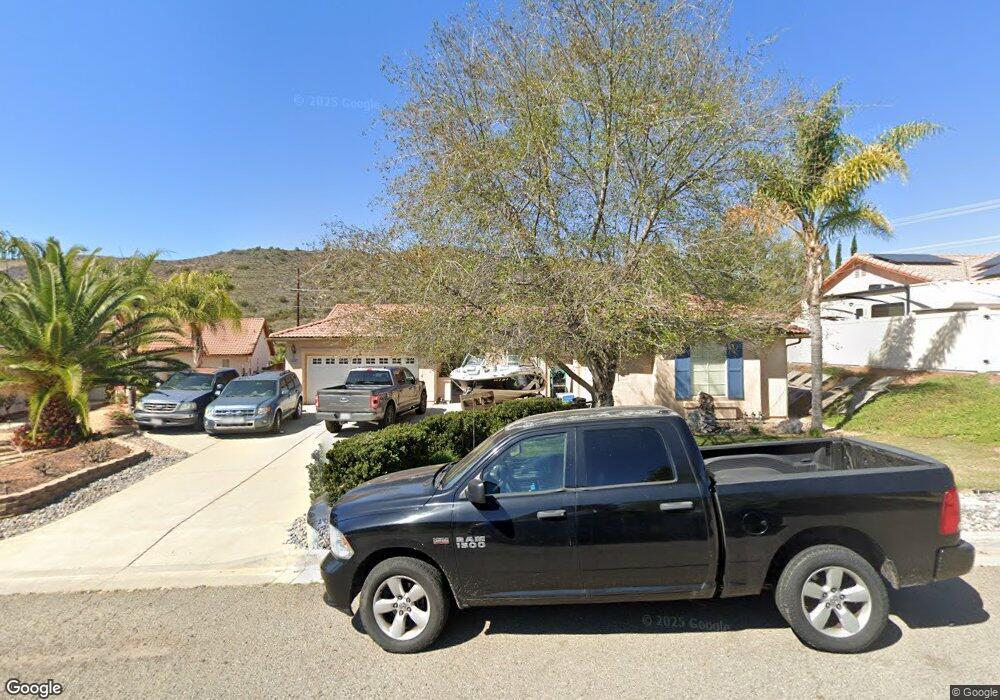
16341 Open View Rd Ramona, CA 92065
San Diego Country Estates NeighborhoodEstimated Value: $1,007,000 - $1,216,000
5
Beds
4
Baths
4,271
Sq Ft
$256/Sq Ft
Est. Value
About This Home
This home is located at 16341 Open View Rd, Ramona, CA 92065 and is currently estimated at $1,095,095, approximately $256 per square foot. 16341 Open View Rd is a home located in San Diego County with nearby schools including Barnett Elementary School, Olive Peirce Middle School, and Ramona High School.
Ownership History
Date
Name
Owned For
Owner Type
Purchase Details
Closed on
Dec 8, 2014
Sold by
Weber Mark T and Weber Kaylene M
Bought by
Weber Mark T and Weber Kaylene M
Current Estimated Value
Home Financials for this Owner
Home Financials are based on the most recent Mortgage that was taken out on this home.
Original Mortgage
$145,000
Outstanding Balance
$111,192
Interest Rate
3.95%
Mortgage Type
New Conventional
Estimated Equity
$983,903
Purchase Details
Closed on
Jun 6, 2007
Sold by
Weber Mark T and Weber Kaylene M
Bought by
Weber Mark T and Weber Kaylene M
Purchase Details
Closed on
Aug 9, 2000
Sold by
Ryland Homes Of California Inc
Bought by
Weber Mark T and Weber Kaylene M
Home Financials for this Owner
Home Financials are based on the most recent Mortgage that was taken out on this home.
Original Mortgage
$251,000
Interest Rate
7.82%
Create a Home Valuation Report for This Property
The Home Valuation Report is an in-depth analysis detailing your home's value as well as a comparison with similar homes in the area
Home Values in the Area
Average Home Value in this Area
Purchase History
| Date | Buyer | Sale Price | Title Company |
|---|---|---|---|
| Weber Mark T | -- | Corinthian Title Company | |
| Weber Mark T | -- | None Available | |
| Weber Mark T | $314,000 | Lawyers Title |
Source: Public Records
Mortgage History
| Date | Status | Borrower | Loan Amount |
|---|---|---|---|
| Open | Weber Mark T | $145,000 | |
| Previous Owner | Weber Mark T | $251,000 |
Source: Public Records
Tax History Compared to Growth
Tax History
| Year | Tax Paid | Tax Assessment Tax Assessment Total Assessment is a certain percentage of the fair market value that is determined by local assessors to be the total taxable value of land and additions on the property. | Land | Improvement |
|---|---|---|---|---|
| 2025 | $9,084 | $768,074 | $180,809 | $587,265 |
| 2024 | $9,084 | $753,014 | $177,264 | $575,750 |
| 2023 | $8,535 | $738,250 | $173,789 | $564,461 |
| 2022 | $8,607 | $723,776 | $170,382 | $553,394 |
| 2021 | $8,471 | $709,586 | $167,042 | $542,544 |
| 2020 | $8,395 | $702,311 | $165,330 | $536,981 |
| 2019 | $8,197 | $688,541 | $162,089 | $526,452 |
| 2018 | $7,984 | $675,041 | $158,911 | $516,130 |
| 2017 | $650 | $661,806 | $155,796 | $506,010 |
| 2016 | $7,666 | $648,831 | $152,742 | $496,089 |
| 2015 | $7,508 | $639,086 | $150,448 | $488,638 |
| 2014 | $7,301 | $626,568 | $147,501 | $479,067 |
Source: Public Records
Map
Nearby Homes
- 23731 Gymkhana Rd
- 23676 Calle Ovieda
- 23833 Gymkhana Rd
- 16345 Bassett Ct
- 16327 Scarbery Rd
- 16328 Bassett Ct
- 16701 Arena Dr
- 23502 Bassett Way
- 24084 Sargeant Rd
- 23540 Oriente Way
- 16333 Oak Springs Dr
- 16403 Arena Dr
- 16310 Oak Springs Dr
- 23164 Vista Ramona Rd
- 17249 Saint Helena Dr
- 24131 Del Amo Rd
- 24332 Del Amo Rd
- 16110 Oak Springs Dr
- 18351 Woods Hill Ln
- 23406 Oakley Place
- 16359 Open View Rd
- 16323 Open View Rd
- 16377 Open View Rd Unit 2
- 17012 Arena Way
- 16305 Open View Rd
- 16350 Open View Rd
- 16395 Open View Rd
- 17024 Arena Way Unit 2
- 16332 Open View Rd Unit 2
- 16378 Open View Rd
- 16310 Open View Rd
- 16396 Open View Rd
- 17030 Arena Way
- 17009 Arena Way
- 23432 Nightsky Rd
- 16989 Arena Way
- 17021 Arena Way
- 16972 Arena Way Unit 2
- 23420 Nightsky Rd
- 23436 Green Glen Rd Unit 2