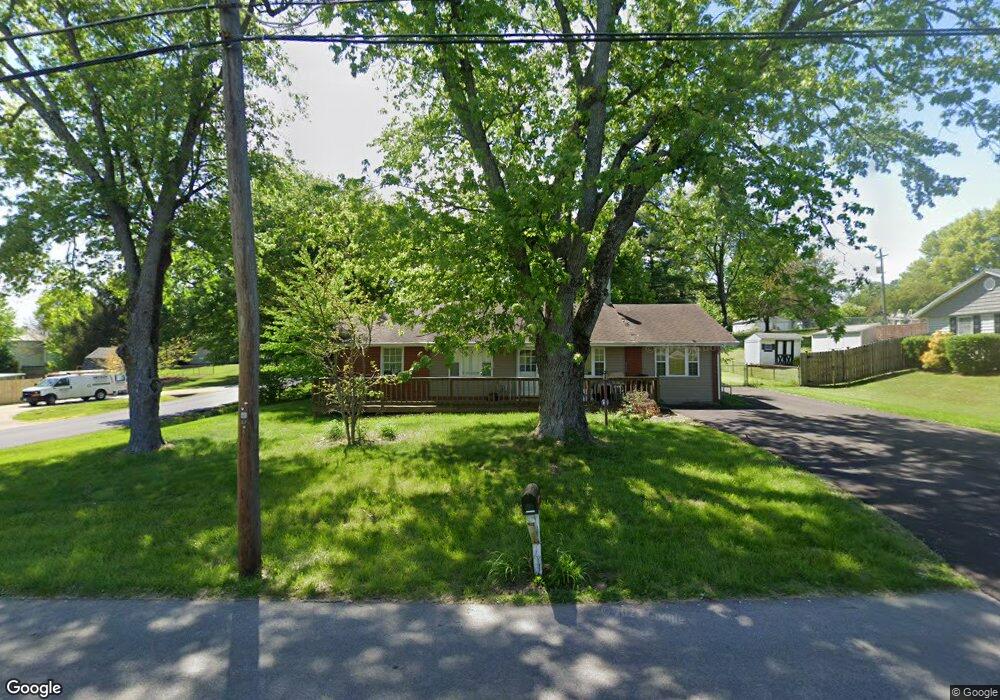
1635 Canal Ln Georgetown, IN 47122
Estimated Value: $192,973 - $235,000
3
Beds
1
Bath
1,280
Sq Ft
$165/Sq Ft
Est. Value
About This Home
This home is located at 1635 Canal Ln, Georgetown, IN 47122 and is currently estimated at $211,243, approximately $165 per square foot. 1635 Canal Ln is a home located in Floyd County with nearby schools including Georgetown Elementary School, Highland Hills Middle School, and Floyd Central High School.
Ownership History
Date
Name
Owned For
Owner Type
Purchase Details
Closed on
Mar 5, 2018
Sold by
Hinton Tonya K
Bought by
Happel Bradon J
Current Estimated Value
Home Financials for this Owner
Home Financials are based on the most recent Mortgage that was taken out on this home.
Original Mortgage
$121,212
Interest Rate
4.4%
Mortgage Type
New Conventional
Purchase Details
Closed on
Mar 9, 2011
Sold by
E & D Properties Llc
Bought by
Hinton Tonya K
Home Financials for this Owner
Home Financials are based on the most recent Mortgage that was taken out on this home.
Original Mortgage
$90,799
Interest Rate
4.87%
Mortgage Type
FHA
Purchase Details
Closed on
Jul 23, 2010
Sold by
Fannie Mae
Bought by
E & D Properties Llc
Purchase Details
Closed on
Feb 11, 2010
Sold by
Wagoner Kenneth W
Bought by
Federal National Mortgage Association
Create a Home Valuation Report for This Property
The Home Valuation Report is an in-depth analysis detailing your home's value as well as a comparison with similar homes in the area
Home Values in the Area
Average Home Value in this Area
Purchase History
| Date | Buyer | Sale Price | Title Company |
|---|---|---|---|
| Happel Bradon J | -- | Legacy Title | |
| Hinton Tonya K | -- | None Available | |
| E & D Properties Llc | -- | Statewide Title Company Inc | |
| Federal National Mortgage Association | $73,643 | None Available |
Source: Public Records
Mortgage History
| Date | Status | Borrower | Loan Amount |
|---|---|---|---|
| Previous Owner | Happel Bradon J | $121,212 | |
| Previous Owner | Hinton Tonya K | $90,799 |
Source: Public Records
Tax History
| Year | Tax Paid | Tax Assessment Tax Assessment Total Assessment is a certain percentage of the fair market value that is determined by local assessors to be the total taxable value of land and additions on the property. | Land | Improvement |
|---|---|---|---|---|
| 2024 | $476 | $90,700 | $26,800 | $63,900 |
| 2023 | $546 | $97,500 | $26,800 | $70,700 |
| 2022 | $579 | $98,200 | $26,800 | $71,400 |
| 2021 | $509 | $92,300 | $26,800 | $65,500 |
| 2020 | $496 | $92,400 | $26,800 | $65,600 |
| 2019 | $484 | $92,400 | $26,800 | $65,600 |
| 2018 | $589 | $96,600 | $26,800 | $69,800 |
| 2017 | $629 | $96,800 | $26,800 | $70,000 |
| 2016 | $514 | $90,100 | $26,800 | $63,300 |
| 2014 | $538 | $90,300 | $26,800 | $63,500 |
| 2013 | -- | $90,000 | $26,800 | $63,200 |
Source: Public Records
Map
Nearby Homes
- 8031 Hudson Ln
- 8026 Hudson Ln
- 1232 Walts Rd
- 2004 Peach Tree Ln
- 1034 Brookstone Ct
- 7014 Dylan Cir
- 7001 - LOT 971 Mitsch Ln
- 6614 State Road 64 Vacant Land
- 7003- LOT 970 Mitsch Ln
- 7005- LOT 969 Mitsch Ln
- 2022 Brookstone Way
- 3006 Zachary Trail
- 4046 Oakstone Dr
- 1004 Carter Dr
- 1034 Oskin Dr Unit 204
- 1036 Oskin Dr Unit 203
- 1040 Oskin Dr Unit 201
- 1038 Oskin Dr Unit 202
- Finch Bonus Plan at Knob Hill
- Haylyn 48' Plan at Knob Hill
Your Personal Tour Guide
Ask me questions while you tour the home.