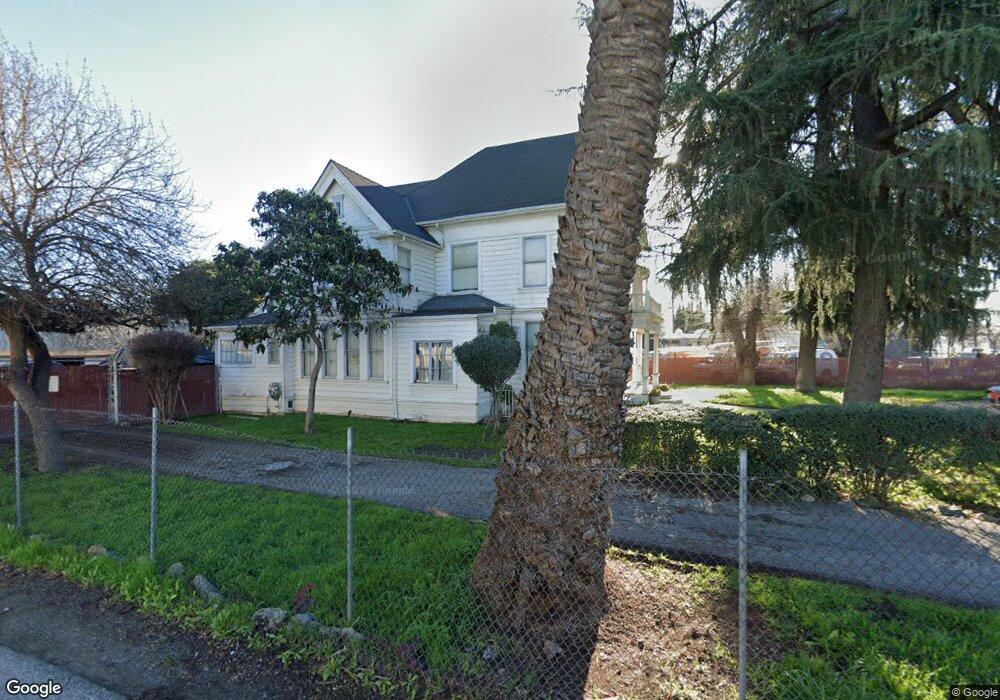
1636 Pomona Ave San Jose, CA 95110
Tamien NeighborhoodEstimated Value: $1,058,000 - $2,068,599
4
Beds
2
Baths
3,232
Sq Ft
$486/Sq Ft
Est. Value
About This Home
This home is located at 1636 Pomona Ave, San Jose, CA 95110 and is currently estimated at $1,570,400, approximately $485 per square foot. 1636 Pomona Ave is a home located in Santa Clara County with nearby schools including George Shirakawa Sr. Elementary School, Sylvandale Middle School, and Yerba Buena High School.
Ownership History
Date
Name
Owned For
Owner Type
Purchase Details
Closed on
Sep 8, 1999
Sold by
Manley Rosa and Casalino Pasquale
Bought by
Casalino Pasquale C
Current Estimated Value
Home Financials for this Owner
Home Financials are based on the most recent Mortgage that was taken out on this home.
Original Mortgage
$251,250
Outstanding Balance
$122,672
Interest Rate
2.95%
Estimated Equity
$1,447,728
Purchase Details
Closed on
Aug 11, 1999
Sold by
Manley Rosa and Casalino Pasquale
Bought by
Manley Rosa and Casalino Dr Pasquale
Home Financials for this Owner
Home Financials are based on the most recent Mortgage that was taken out on this home.
Original Mortgage
$251,250
Outstanding Balance
$122,672
Interest Rate
2.95%
Estimated Equity
$1,447,728
Purchase Details
Closed on
Aug 2, 1995
Sold by
Casalino Constantino
Bought by
Manley Rosa and Casalino Pasquale
Purchase Details
Closed on
Aug 9, 1994
Sold by
Casalino Constantino
Bought by
Manley Rosa and Casalino Pasquale
Create a Home Valuation Report for This Property
The Home Valuation Report is an in-depth analysis detailing your home's value as well as a comparison with similar homes in the area
Home Values in the Area
Average Home Value in this Area
Purchase History
| Date | Buyer | Sale Price | Title Company |
|---|---|---|---|
| Casalino Pasquale C | $200,000 | Financial Title Company | |
| Manley Rosa | $50,000 | Financial Title Company | |
| Manley Rosa | -- | -- | |
| Manley Rosa | -- | -- |
Source: Public Records
Mortgage History
| Date | Status | Borrower | Loan Amount |
|---|---|---|---|
| Open | Casalino Pasquale C | $251,250 |
Source: Public Records
Tax History Compared to Growth
Tax History
| Year | Tax Paid | Tax Assessment Tax Assessment Total Assessment is a certain percentage of the fair market value that is determined by local assessors to be the total taxable value of land and additions on the property. | Land | Improvement |
|---|---|---|---|---|
| 2025 | $8,259 | $479,180 | $328,776 | $150,404 |
| 2024 | $8,259 | $469,785 | $322,330 | $147,455 |
| 2023 | $8,124 | $460,574 | $316,010 | $144,564 |
| 2022 | $7,949 | $451,544 | $309,814 | $141,730 |
| 2021 | $7,853 | $442,691 | $303,740 | $138,951 |
| 2020 | $7,508 | $438,153 | $300,626 | $137,527 |
| 2019 | $7,184 | $429,563 | $294,732 | $134,831 |
| 2018 | $7,151 | $421,141 | $288,953 | $132,188 |
| 2017 | $7,050 | $412,885 | $283,288 | $129,597 |
| 2016 | $6,710 | $404,790 | $277,734 | $127,056 |
| 2015 | $7,072 | $398,711 | $273,563 | $125,148 |
| 2014 | $5,729 | $390,902 | $268,205 | $122,697 |
Source: Public Records
Map
Nearby Homes
- 1595 Pomona Ave
- 1536 Little Orchard St
- 1488 Pomona Ave
- 1497 Sanborn Ave
- 1493 Sanborn Ave
- 237 Shadow Dance Dr
- 271 Shadow Dance Dr
- 316 Stonegate Cir
- 331 Shadow Run Dr
- 198 Floyd St
- 1376 Palm St
- 500 Shadowgraph Dr
- 510 Shadowgraph Dr
- 482 Shadowgraph Dr
- 1210 Mastic St
- 82 Hollywood Ave
- 114 Hollywood Ave
- 429 Willow Glen Ct
- 1144 Locust St
- 1148 Palm St
- 120 San Jose Ave
- 123 San Jose Ave
- 1635 Pomona Ave
- 1650 Pomona Ave
- 1639 Pomona Ave
- 110 San Jose Ave
- 102 San Jose Ave
- 96 San Jose Ave
- 1605 Pomona Ave
- 186 San Jose Ave
- 88 San Jose Ave
- 0 Pomona Ave
- 149 Bellevue Ave
- 1595 Pomona Ave Unit A
- 1595 Pomona Ave Unit B
- 60 San Jose Ave
- 1584 Pomona Ave
- 137 Bellevue Ave
- 131 Bellevue Ave
- 1587 Pomona Ave