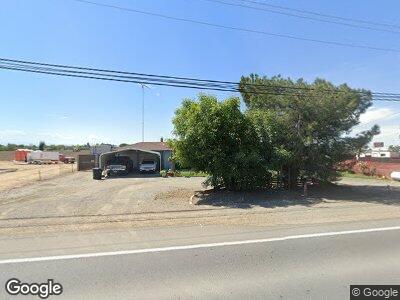
16363 S Mercey Springs Rd Los Banos, CA 93635
Estimated Value: $441,674 - $490,000
3
Beds
2
Baths
1,516
Sq Ft
$303/Sq Ft
Est. Value
About This Home
This home is located at 16363 S Mercey Springs Rd, Los Banos, CA 93635 and is currently estimated at $459,169, approximately $302 per square foot. 16363 S Mercey Springs Rd is a home located in Merced County with nearby schools including Los Banos Elementary School, Creekside Junior High School, and Los Banos High School.
Ownership History
Date
Name
Owned For
Owner Type
Purchase Details
Closed on
Jul 20, 2009
Sold by
Brunk Catherine B
Bought by
Ferrel Victor
Current Estimated Value
Home Financials for this Owner
Home Financials are based on the most recent Mortgage that was taken out on this home.
Original Mortgage
$146,301
Interest Rate
5.09%
Mortgage Type
FHA
Purchase Details
Closed on
Jun 21, 1999
Sold by
Alberti Ronald Emil
Bought by
Brunk Catherine B
Home Financials for this Owner
Home Financials are based on the most recent Mortgage that was taken out on this home.
Original Mortgage
$121,100
Interest Rate
7%
Mortgage Type
Purchase Money Mortgage
Purchase Details
Closed on
Jun 11, 1999
Sold by
Alberti Lora
Bought by
Alberti Ronald Emil
Home Financials for this Owner
Home Financials are based on the most recent Mortgage that was taken out on this home.
Original Mortgage
$121,100
Interest Rate
7%
Mortgage Type
Purchase Money Mortgage
Create a Home Valuation Report for This Property
The Home Valuation Report is an in-depth analysis detailing your home's value as well as a comparison with similar homes in the area
Home Values in the Area
Average Home Value in this Area
Purchase History
| Date | Buyer | Sale Price | Title Company |
|---|---|---|---|
| Ferrel Victor | $149,000 | Transcounty Title Company | |
| Brunk Catherine B | $127,500 | Transcounty Title Company |
Source: Public Records
Mortgage History
| Date | Status | Borrower | Loan Amount |
|---|---|---|---|
| Open | Ferrel Victor | $121,054 | |
| Closed | Ferrel Victor | $144,638 | |
| Closed | Ferrel Victor | $146,301 | |
| Previous Owner | Brunk Catherine B | $121,100 |
Source: Public Records
Tax History Compared to Growth
Tax History
| Year | Tax Paid | Tax Assessment Tax Assessment Total Assessment is a certain percentage of the fair market value that is determined by local assessors to be the total taxable value of land and additions on the property. | Land | Improvement |
|---|---|---|---|---|
| 2024 | $2,053 | $188,546 | $25,303 | $163,243 |
| 2023 | $1,938 | $184,850 | $24,807 | $160,043 |
| 2022 | $1,908 | $181,226 | $24,321 | $156,905 |
| 2021 | $1,888 | $177,674 | $23,845 | $153,829 |
| 2020 | $1,867 | $175,853 | $23,601 | $152,252 |
| 2019 | $1,832 | $172,406 | $23,139 | $149,267 |
| 2018 | $1,776 | $169,027 | $22,686 | $146,341 |
| 2017 | $1,754 | $165,714 | $22,242 | $143,472 |
| 2016 | $1,773 | $162,465 | $21,806 | $140,659 |
| 2015 | $1,735 | $160,026 | $21,479 | $138,547 |
| 2014 | $1,665 | $155,000 | $30,000 | $125,000 |
Source: Public Records
Map
Nearby Homes
- 1519 S 11th St
- 1046 Van Buren Ave
- 1613 Pomona St
- 2028 Princeton Ct
- 2083 Hastings Dr
- 709 Madison Ave
- 945 9th St
- 658 Page Ave
- 1974 Rainier Dr
- 945 F St
- 960 F St
- 2151 E Pacheco Blvd Unit 57
- 2151 E Pacheco Blvd Unit 78
- 2151 E Pacheco Blvd Unit SPC 80
- 926 F St
- 2013 Gus Villalta Dr
- 2149 E Pacheco Blvd
- 615 Page Ave
- 1735 S 6th St
- 200 J St
- 16363 S Mercey Springs Rd
- 16339 S Mercey Springs Rd
- 1805 Pat St
- 1809 Pat St
- 1813 Pat St
- 1817 Pat St
- 1821 Pat St
- 1825 Pat St
- 1829 Pat St
- 1820 Pat St
- 1824 Pat St
- 1833 Pat St
- 1801 Spadafore St
- 1805 Spadafore St
- 1809 Spadafore St
- 1828 Pat St
- 1813 Spadafore St
- 1817 Spadafore St
- 1321 Thomas St
- 1821 Spadafore St