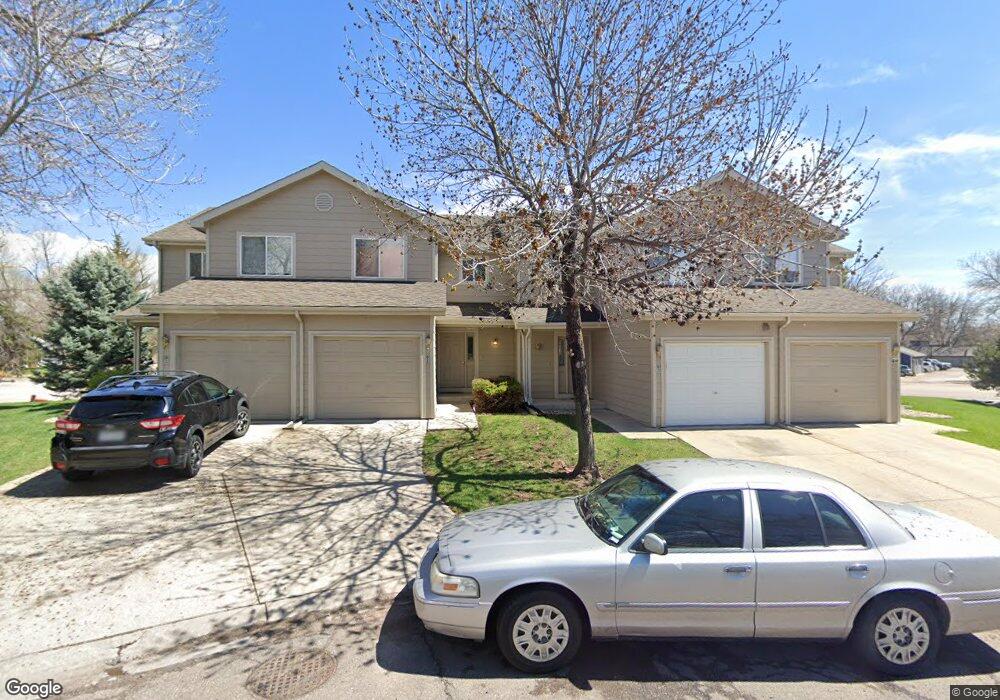
1637 Westbridge Dr Unit G4 Fort Collins, CO 80526
Foothills Green NeighborhoodEstimated Value: $361,000 - $422,000
3
Beds
5
Baths
1,371
Sq Ft
$293/Sq Ft
Est. Value
About This Home
This home is located at 1637 Westbridge Dr Unit G4, Fort Collins, CO 80526 and is currently estimated at $401,195, approximately $292 per square foot. 1637 Westbridge Dr Unit G4 is a home located in Larimer County with nearby schools including Bennett Elementary School, Blevins Middle School, and Rocky Mountain High School.
Ownership History
Date
Name
Owned For
Owner Type
Purchase Details
Closed on
Jun 15, 2007
Sold by
Kircher James E and Kircher Mickie L
Bought by
Quinn Rodney and Quinn Diane
Current Estimated Value
Purchase Details
Closed on
May 23, 2003
Sold by
Medoff Dmitri
Bought by
Kircher James E and Kircher Mickie L
Home Financials for this Owner
Home Financials are based on the most recent Mortgage that was taken out on this home.
Original Mortgage
$136,000
Interest Rate
5.74%
Mortgage Type
Purchase Money Mortgage
Purchase Details
Closed on
Jul 10, 1998
Sold by
Moth Sean E and Moth Larry Allen
Bought by
Medoff Dmitri
Home Financials for this Owner
Home Financials are based on the most recent Mortgage that was taken out on this home.
Original Mortgage
$110,000
Interest Rate
7.09%
Purchase Details
Closed on
Nov 1, 1995
Sold by
Jms Properties Ltd
Bought by
Moth Carol Faye
Create a Home Valuation Report for This Property
The Home Valuation Report is an in-depth analysis detailing your home's value as well as a comparison with similar homes in the area
Home Values in the Area
Average Home Value in this Area
Purchase History
| Date | Buyer | Sale Price | Title Company |
|---|---|---|---|
| Quinn Rodney | $172,500 | None Available | |
| Kircher James E | $170,000 | Land Title Guarantee Company | |
| Medoff Dmitri | $124,750 | -- | |
| Moth Carol Faye | $119,200 | -- |
Source: Public Records
Mortgage History
| Date | Status | Borrower | Loan Amount |
|---|---|---|---|
| Previous Owner | Kircher James E | $136,000 | |
| Previous Owner | Medoff Dmitri | $110,000 |
Source: Public Records
Tax History Compared to Growth
Tax History
| Year | Tax Paid | Tax Assessment Tax Assessment Total Assessment is a certain percentage of the fair market value that is determined by local assessors to be the total taxable value of land and additions on the property. | Land | Improvement |
|---|---|---|---|---|
| 2025 | $2,496 | $29,701 | $2,412 | $27,289 |
| 2024 | $2,375 | $29,701 | $2,412 | $27,289 |
| 2022 | $2,087 | $22,101 | $2,502 | $19,599 |
| 2021 | $2,109 | $22,737 | $2,574 | $20,163 |
| 2020 | $2,067 | $22,094 | $2,574 | $19,520 |
| 2019 | $2,076 | $22,094 | $2,574 | $19,520 |
| 2018 | $1,916 | $21,024 | $2,592 | $18,432 |
| 2017 | $1,910 | $21,024 | $2,592 | $18,432 |
| 2016 | $1,584 | $17,353 | $2,866 | $14,487 |
| 2015 | $1,573 | $18,130 | $2,870 | $15,260 |
| 2014 | $1,344 | $14,730 | $2,870 | $11,860 |
Source: Public Records
Map
Nearby Homes
- 1680 Foxbrook Way
- 2001 W Prospect Rd
- 1705 Heatheridge Rd Unit A104
- 1705 Heatheridge Rd Unit K105
- 1705 Heatheridge Rd Unit L201
- 1705 Heatheridge Rd Unit E101
- 1705 Heatheridge Rd Unit M204
- 1705 Heatheridge Rd Unit G302
- 1854 Marlborough Ct
- 2001 Evergreen Dr
- 1955 Kingsborough Dr
- 1421 W Lake St
- 1701 Glenwood Dr
- 1333 Village Park Ct
- 1308 W Prospect Rd
- 1304 W Prospect Rd
- 1213 S Taft Hill Rd
- 1300 W Stuart St Unit 23
- 2213 Shropshire Ave
- 1513 Independence Rd
- 1637 Westbridge Dr Unit O4
- 1637 Westbridge Dr Unit O3
- 1637 Westbridge Dr Unit O2
- 1637 Westbridge Dr Unit O1
- 1637 Westbridge Dr Unit N4
- 1637 Westbridge Dr Unit N3
- 1637 Westbridge Dr Unit N2
- 1637 Westbridge Dr Unit N1
- 1637 Westbridge Dr Unit M4
- 1637 Westbridge Dr Unit M3
- 1637 Westbridge Dr Unit M2
- 1637 Westbridge Dr Unit M1
- 1637 Westbridge Dr Unit L4
- 1637 Westbridge Dr Unit L3
- 1637 Westbridge Dr Unit L2
- 1637 Westbridge Dr Unit L1
- 1637 Westbridge Dr Unit K4
- 1637 Westbridge Dr Unit K3
- 1637 Westbridge Dr Unit K2
- 1637 Westbridge Dr Unit K1