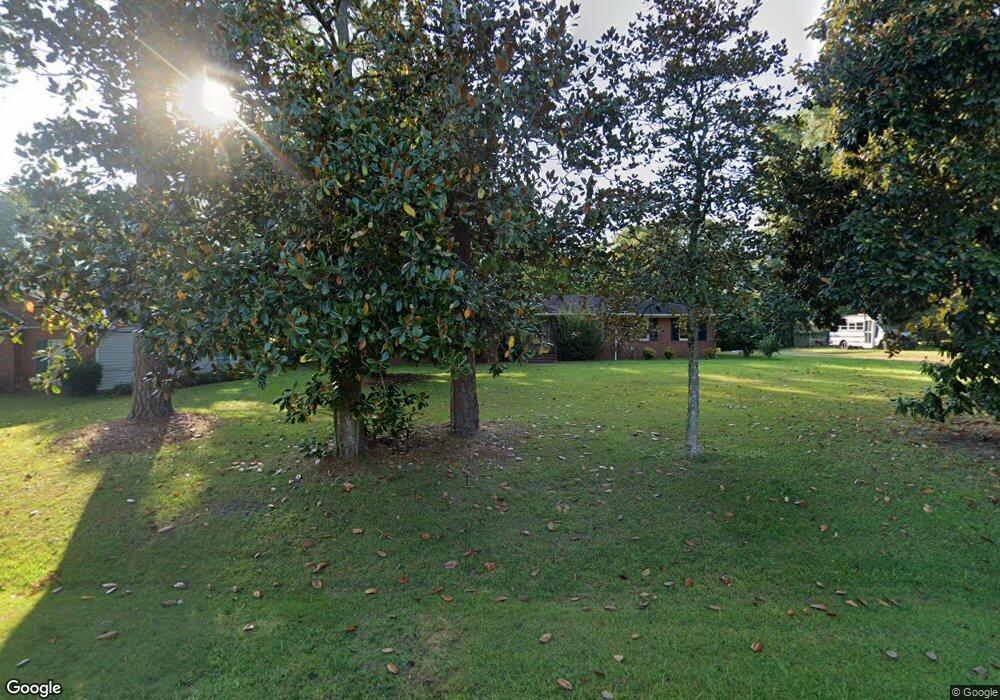
1638 Celeste Dr Columbus, GA 31907
East Columbus NeighborhoodEstimated Value: $162,000 - $176,495
3
Beds
3
Baths
1,620
Sq Ft
$103/Sq Ft
Est. Value
About This Home
This home is located at 1638 Celeste Dr, Columbus, GA 31907 and is currently estimated at $166,874, approximately $103 per square foot. 1638 Celeste Dr is a home located in Muscogee County with nearby schools including Wesley Heights Elementary School, East Columbus Magnet Academy, and Kendrick High School.
Ownership History
Date
Name
Owned For
Owner Type
Purchase Details
Closed on
Jul 25, 2017
Sold by
Secretary Of Hud
Bought by
Jones Harvey L
Current Estimated Value
Purchase Details
Closed on
Mar 2, 2017
Bought by
Secretary Of Housing & Urban D and C/O Ins Corp
Purchase Details
Closed on
Jan 3, 2017
Sold by
Jeter Gail
Bought by
Bank Of America
Purchase Details
Closed on
Sep 30, 2010
Sold by
Kennon Realty Services Inc
Bought by
Jeter Gail
Home Financials for this Owner
Home Financials are based on the most recent Mortgage that was taken out on this home.
Original Mortgage
$128,272
Interest Rate
5.5%
Mortgage Type
FHA
Purchase Details
Closed on
May 6, 2009
Sold by
Federal National Mortgage Association
Bought by
Kennon Realty Services Inc
Purchase Details
Closed on
Mar 4, 2009
Sold by
Peak Fred D
Bought by
Countrywide Home Loans Servicing Lp
Create a Home Valuation Report for This Property
The Home Valuation Report is an in-depth analysis detailing your home's value as well as a comparison with similar homes in the area
Home Values in the Area
Average Home Value in this Area
Purchase History
| Date | Buyer | Sale Price | Title Company |
|---|---|---|---|
| Jones Harvey L | $45,000 | -- | |
| Secretary Of Housing & Urban D | -- | -- | |
| Bank Of America | -- | -- | |
| Jeter Gail | $130,000 | None Available | |
| Kennon Realty Services Inc | -- | None Available | |
| Kennon Realty Services Inc | -- | None Available | |
| Countrywide Home Loans Servicing Lp | $101,857 | None Available |
Source: Public Records
Mortgage History
| Date | Status | Borrower | Loan Amount |
|---|---|---|---|
| Previous Owner | Jeter Gail | $128,272 |
Source: Public Records
Tax History
| Year | Tax Paid | Tax Assessment Tax Assessment Total Assessment is a certain percentage of the fair market value that is determined by local assessors to be the total taxable value of land and additions on the property. | Land | Improvement |
|---|---|---|---|---|
| 2025 | $1,933 | $49,372 | $9,332 | $40,040 |
| 2024 | $1,933 | $49,372 | $9,332 | $40,040 |
| 2023 | $1,945 | $49,372 | $9,332 | $40,040 |
| 2022 | $1,671 | $40,920 | $9,332 | $31,588 |
| 2021 | $1,017 | $24,848 | $9,332 | $15,516 |
| 2020 | $1,015 | $24,848 | $9,332 | $15,516 |
| 2019 | $1,018 | $24,848 | $9,332 | $15,516 |
| 2018 | $737 | $18,000 | $6,760 | $11,240 |
| 2017 | $1,693 | $41,196 | $14,584 | $26,612 |
| 2016 | $1,595 | $51,937 | $8,981 | $42,956 |
| 2015 | $1,597 | $51,937 | $8,981 | $42,956 |
| 2014 | $1,600 | $51,937 | $8,981 | $42,956 |
| 2013 | -- | $51,937 | $8,981 | $42,956 |
Source: Public Records
Map
Nearby Homes
- 6213 Fitzgerald Dr
- 6293 Dupree Dr
- 6270 Mill Branch Rd
- 6021 Luna Dr
- 1925 Woodhollow Dr
- 6033 Luna Dr
- 6061 Luna Dr
- 1314 Pagoda Dr
- 5773 Marlette Ct
- 6040 Luna Dr
- 1524 Mazor Dr
- 5834 Blueridge Dr
- 2312 Burnside Dr
- 5725 Marlette Ct
- 5802 Blueridge Dr
- 6311 Morning Dew Dr
- 6303 Morning Dew Dr
- 6307 Morning Dew Dr
- 6302 Morning Dew Dr
- 2525 Corineth Dr
- 1642 Celeste Dr
- 1624 Celeste Dr
- 1646 Celeste Dr
- 1637 Celeste Dr
- 5577 Eastbrook Ln
- 1612 Celeste Dr
- 1623 Celeste Dr
- 1654 Celeste Dr
- 1602 Celeste Dr
- 7001 Hunter Hill Ct
- 1707 Laney Dr
- 1701 Laney Dr
- 7000 Hunter Hill Ct
- 1660 Celeste Dr
- 1715 Laney Dr
- 1631 Laney Dr
- 5575 Glenview Dr
- 1841 Celeste Dr
- 5568 Eastbrook Ln
- 5561 Eastbrook Ln
Your Personal Tour Guide
Ask me questions while you tour the home.