1639 E Miki Way Lancaster, CA 93535
East Lancaster NeighborhoodEstimated Value: $553,850 - $605,000
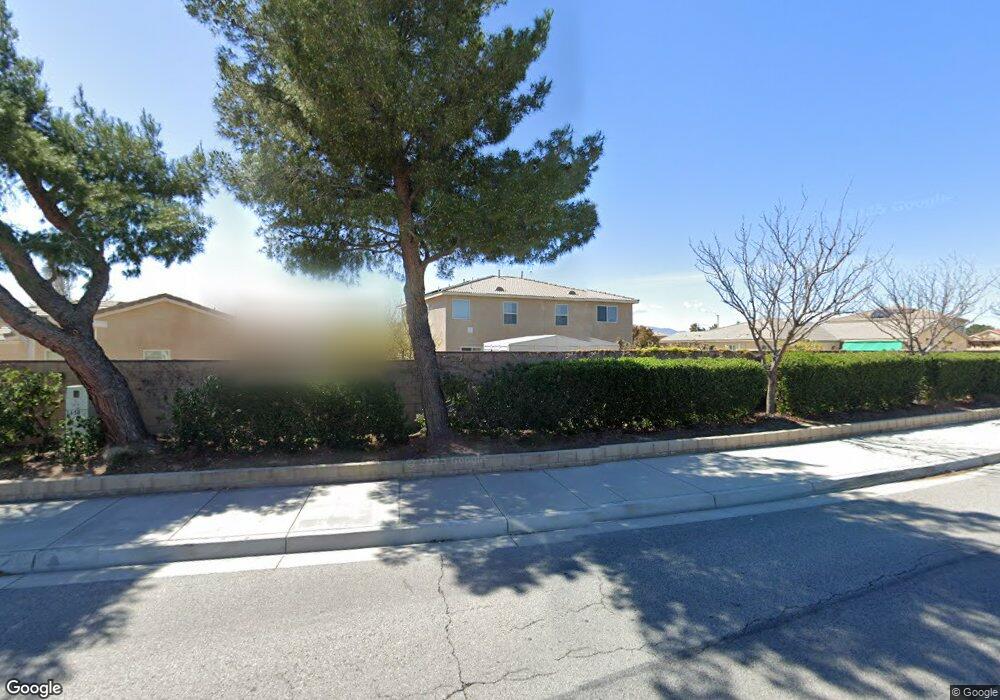
About This Home
This home is located at 1639 E Miki Way, Lancaster, CA 93535 and is currently estimated at $571,713, approximately $184 per square foot. 1639 E Miki Way is a home located in Los Angeles County with nearby schools including Jack Northrop Elementary School, New Vista Middle School, and Eastside High School.
Ownership History
We collect this data history from publicly available records. To have your information removed, we recommend requesting removal directly through your county’s website.
Purchase Details
Home Financials for this Owner
Home Financials are based on the most recent Mortgage that was taken out on this home.Purchase Details
Purchase Details
Purchase Details
Home Financials for this Owner
Home Financials are based on the most recent Mortgage that was taken out on this home.Home Values in the Area
Average Home Value in this Area
Purchase History
We collect this data history from publicly available records. To have your information removed, we recommend requesting removal directly through your county’s website.
| Date | Buyer | Sale Price | Title Company |
|---|---|---|---|
| -- | Amrock Inc | ||
| -- | Amrock Inc | ||
| -- | None Available | ||
| -- | None Available | ||
| $423,500 | Orange Coast Title Company |
Mortgage History
We collect this data history from publicly available records. To have your information removed, we recommend requesting removal directly through your county’s website.
| Date | Status | Borrower | Loan Amount |
|---|---|---|---|
| Open | $300,000 | ||
| Closed | $338,550 |
Tax History
We collect this data history from publicly available records. To have your information removed, we recommend requesting removal directly through your county’s website.
| Year | Tax Paid | Tax Assessment Tax Assessment Total Assessment is a certain percentage of the fair market value that is determined by local assessors to be the total taxable value of land and additions on the property. | Land | Improvement |
|---|---|---|---|---|
| 2025 | $7,190 | $438,270 | $140,225 | $298,045 |
| 2024 | $6,824 | $429,677 | $137,476 | $292,201 |
| 2023 | $6,679 | $421,253 | $134,781 | $286,472 |
| 2022 | $6,422 | $412,994 | $132,139 | $280,855 |
| 2021 | $5,979 | $404,898 | $129,549 | $275,349 |
| 2020 | $5,490 | $366,000 | $130,500 | $235,500 |
| 2019 | $5,476 | $366,000 | $130,500 | $235,500 |
| 2018 | $5,207 | $344,500 | $122,800 | $221,700 |
| 2016 | $5,017 | $312,000 | $111,200 | $200,800 |
| 2015 | $4,503 | $268,900 | $95,800 | $173,100 |
| 2014 | $3,379 | $171,000 | $60,900 | $110,100 |
Map
- 43619 Steif St
- 1549 Thomas Dr
- 1554 Granville Way
- 43711 16th St E
- 1519 Michelle Ave
- 1518 E Avenue J-12
- 1718 Whitlatch Dr
- 1518 E Avenue j12
- 1642 Bisbee Place
- 0 St Unit 26002646
- 87 E Avenue J 12
- 117 E Avenue J 12
- 43461 Huron St
- 1247 Marion Ave
- 43525 Palos Way
- 43709 Castle Cir
- 43901 Fallon Dr
- 43920 Comstock Ave
- 43527 Grange St
- 43922 Fallon Dr
- 1647 E Miki Way
- 1629 E Miki Way
- 1638 E Miki Way
- 1655 E Miki Way
- 1621 E Miki Way
- 1648 E Miki Way
- 1617 Thomas Dr
- 1625 Thomas Dr
- 1637 E Avenue K
- 1643 E Avenue K
- 1615 E Miki Way
- 1633 Thomas Dr
- 1631 E Avenue K
- 1658 E Miki Way
- 1649 E Avenue K
- 1641 Thomas Dr
- 1625 E Avenue K
- 1707 E Miki Way
- 1655 E Avenue K
- 1649 Thomas Dr
Ask me questions while you tour the home.