
Seller's Agent in 2025
Chad Schwendeman
eXp Realty
(218) 831-4663
184 in this area
1,452 Total Sales
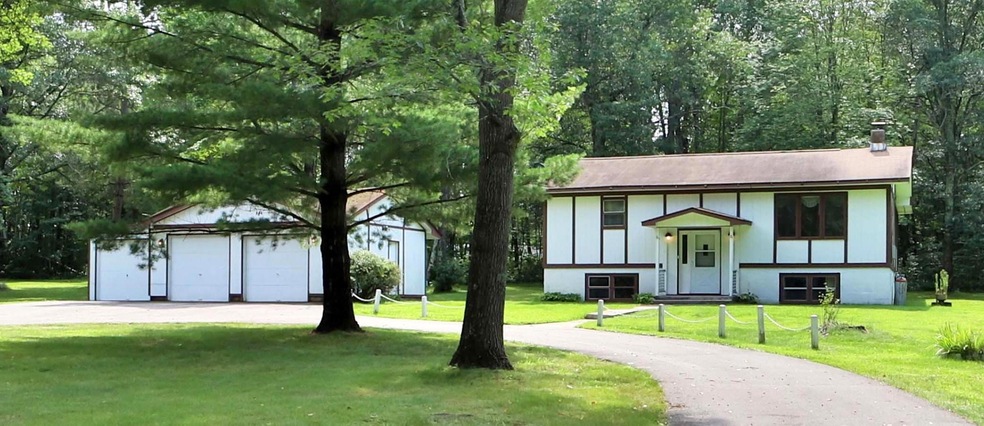


First time on the market! This 3-bedroom, 2-bathroom home sits on a sprawling 4.46 acres, offering a perfect blend of cleared land and serene woods. Located just minutes from Brainerd, it provides the privacy you are looking for, along with the convenience of nearby amenities. Start your day with coffee on the deck or unwind in the three-season porch beside the wood-burning fireplace during the colder months. A three-stall detached garage and a large storage shed offer ample space for vehicles, tools, outdoor gear, and toys.
Last Agent to Sell the Property
eXp Realty Brokerage Phone: 218-831-4663 Listed on: 08/14/2025
| Date | Type | Sale Price | Title Company |
|---|---|---|---|
| Warranty Deed | $225,000 | Lawyers Title Services |
| Date | Status | Loan Amount | Loan Type |
|---|---|---|---|
| Open | $191,250 | New Conventional |
| Date | Event | Price | List to Sale | Price per Sq Ft |
|---|---|---|---|---|
| 10/20/2025 10/20/25 | Sold | $225,000 | 0.0% | $260 / Sq Ft |
| 10/06/2025 10/06/25 | Pending | -- | -- | -- |
| 09/25/2025 09/25/25 | Off Market | $225,000 | -- | -- |
| 09/09/2025 09/09/25 | Price Changed | $259,900 | -5.5% | $301 / Sq Ft |
| 08/22/2025 08/22/25 | For Sale | $274,900 | -- | $318 / Sq Ft |
| Year | Tax Paid | Tax Assessment Tax Assessment Total Assessment is a certain percentage of the fair market value that is determined by local assessors to be the total taxable value of land and additions on the property. | Land | Improvement |
|---|---|---|---|---|
| 2025 | $1,462 | $255,300 | $85,300 | $170,000 |
| 2024 | $1,462 | $247,800 | $86,100 | $161,700 |
| 2023 | $1,360 | $241,500 | $80,700 | $160,800 |
| 2022 | $1,484 | $211,300 | $56,900 | $154,400 |
| 2021 | $1,518 | $183,200 | $54,500 | $128,700 |
| 2020 | $1,334 | $178,200 | $51,100 | $127,100 |
| 2019 | $1,224 | $155,300 | $46,100 | $109,200 |
| 2018 | $1,056 | $147,900 | $42,700 | $105,200 |
| 2017 | $1,062 | $111,872 | $34,020 | $77,852 |
| 2016 | $1,012 | $102,900 | $33,500 | $69,400 |
| 2015 | $1,022 | $99,400 | $33,200 | $66,200 |
| 2014 | $501 | $102,800 | $33,500 | $69,300 |
Seller's Agent in 2025
Chad Schwendeman
eXp Realty
(218) 831-4663
184 in this area
1,452 Total Sales
Seller Co-Listing Agent in 2025
Sean Mello
eXp Realty
(218) 821-7776
3 in this area
21 Total Sales
S
Buyer's Agent in 2025
Savannah Mello
eXp Realty
(218) 513-8727
16 in this area
90 Total Sales
Source: NorthstarMLS
MLS Number: 6770672
APN: 790103100C00009
Disclaimer: Certain information contained herein is derived from information provided by parties other than Homes.com. All information provided is deemed reliable, but is not guaranteed to be accurate and should be independently verified.
![]() Based on information submitted to the MLS GRID. All data is obtained from various sources and may not have been verified by broker or MLS GRID. Supplied Open House Information is subject to change without notice. All information should be independently reviewed and verified for accuracy. Properties may or may not be listed by the office/agent presenting the information. Some IDX listings have been excluded from this website.
Based on information submitted to the MLS GRID. All data is obtained from various sources and may not have been verified by broker or MLS GRID. Supplied Open House Information is subject to change without notice. All information should be independently reviewed and verified for accuracy. Properties may or may not be listed by the office/agent presenting the information. Some IDX listings have been excluded from this website.
Based on information submitted to the MLS GRID
Ask me questions while you tour the home.