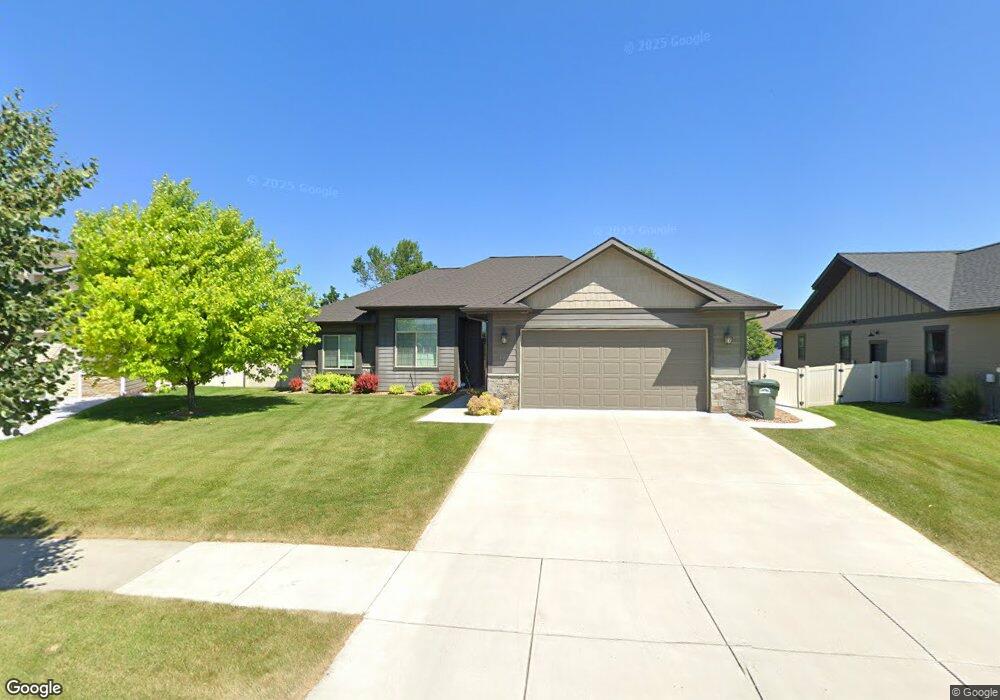
164 Ali Loop Kalispell, MT 59901
Estimated Value: $632,000 - $721,000
3
Beds
2
Baths
1,788
Sq Ft
$376/Sq Ft
Est. Value
About This Home
This home is located at 164 Ali Loop, Kalispell, MT 59901 and is currently estimated at $672,312, approximately $376 per square foot. 164 Ali Loop is a home located in Flathead County with nearby schools including West Valley Elementary School, West Valley Middle School, and Glacier High School.
Ownership History
Date
Name
Owned For
Owner Type
Purchase Details
Closed on
Nov 15, 2016
Sold by
Waller Patti
Bought by
Gebert Gary S and Dunn Candice K
Current Estimated Value
Home Financials for this Owner
Home Financials are based on the most recent Mortgage that was taken out on this home.
Original Mortgage
$55,000
Outstanding Balance
$26,106
Interest Rate
3.47%
Mortgage Type
New Conventional
Estimated Equity
$646,206
Purchase Details
Closed on
Feb 3, 2014
Sold by
Waller Patti
Bought by
Waller Patti and Patti Waller Trust Agreement
Purchase Details
Closed on
Dec 20, 2013
Sold by
West Chris and West Marcie
Bought by
Waller Patti
Purchase Details
Closed on
Feb 12, 2013
Sold by
Owl Corporation
Bought by
West Chris and West Marcie
Home Financials for this Owner
Home Financials are based on the most recent Mortgage that was taken out on this home.
Original Mortgage
$55,000
Interest Rate
3.32%
Mortgage Type
Seller Take Back
Create a Home Valuation Report for This Property
The Home Valuation Report is an in-depth analysis detailing your home's value as well as a comparison with similar homes in the area
Purchase History
| Date | Buyer | Sale Price | Title Company |
|---|---|---|---|
| Gebert Gary S | -- | Insured Titles | |
| Waller Patti | -- | None Available | |
| Waller Patti | -- | Fidelity National Title | |
| West Chris | -- | Insured Titles |
Source: Public Records
Mortgage History
| Date | Status | Borrower | Loan Amount |
|---|---|---|---|
| Open | Gebert Gary S | $55,000 | |
| Previous Owner | West Chris | $55,000 |
Source: Public Records
Tax History
| Year | Tax Paid | Tax Assessment Tax Assessment Total Assessment is a certain percentage of the fair market value that is determined by local assessors to be the total taxable value of land and additions on the property. | Land | Improvement |
|---|---|---|---|---|
| 2025 | $3,640 | $679,400 | $0 | $0 |
| 2024 | $3,586 | $497,800 | $0 | $0 |
| 2023 | $3,965 | $497,800 | $0 | $0 |
| 2022 | $3,304 | $364,300 | $0 | $0 |
| 2021 | $3,755 | $364,300 | $0 | $0 |
| 2020 | $3,800 | $325,900 | $0 | $0 |
| 2019 | $3,754 | $325,900 | $0 | $0 |
| 2018 | $3,528 | $285,700 | $0 | $0 |
| 2017 | $3,525 | $285,700 | $0 | $0 |
| 2016 | $3,190 | $262,800 | $0 | $0 |
| 2015 | $3,221 | $262,800 | $0 | $0 |
| 2014 | $3,221 | $156,509 | $0 | $0 |
Source: Public Records
Map
Nearby Homes
- 143 Lumberjack Place
- 131 Lumberjack Place
- 127 Lumberjack Place
- 134 Lumberjack Place
- 138 Lumberjack Place
- 208 Junebug Ct
- 155 Lumberjack Place
- 112 Owens Ct
- 212 Junebug Ct
- 154 Lumberjack Place
- 114 Lumberjack Place
- 106 Lumberjack Place
- 50 Dawson Ln
- 44 Dawson Ln
- 26 Kintla Way
- 118 Essex Place
- 11 Grizzly Way
- 292 E Bowman Dr
- 194 Arbour Dr
- 348 Stillwater Loop
- 164 Ali Loop Unit Lot 87
- 164 Ali Loop
- 168 Ali Loop Unit Lot 86
- 168 Ali Loop
- 186 Taelor Rd
- 160 Ali Loop Unit Lot 88
- 160 Ali Loop
- 182 Taelor Rd Unit Lot 85
- 182 Taelor Rd
- 190 Taelor Rd
- 156 Ali Loop Unit Lot 89
- 156 Ali Loop
- 152 Ali Loop Unit Lot 90
- 152 Ali Loop
- 194 Taelor Rd Unit Lot 82
- 194 Taelor Rd
- 172 Ali Loop Unit Lot 114
- 172 Ali Loop
- 178 Taelor Rd Unit Lot 113
- 178 Taelor Rd
Your Personal Tour Guide
Ask me questions while you tour the home.