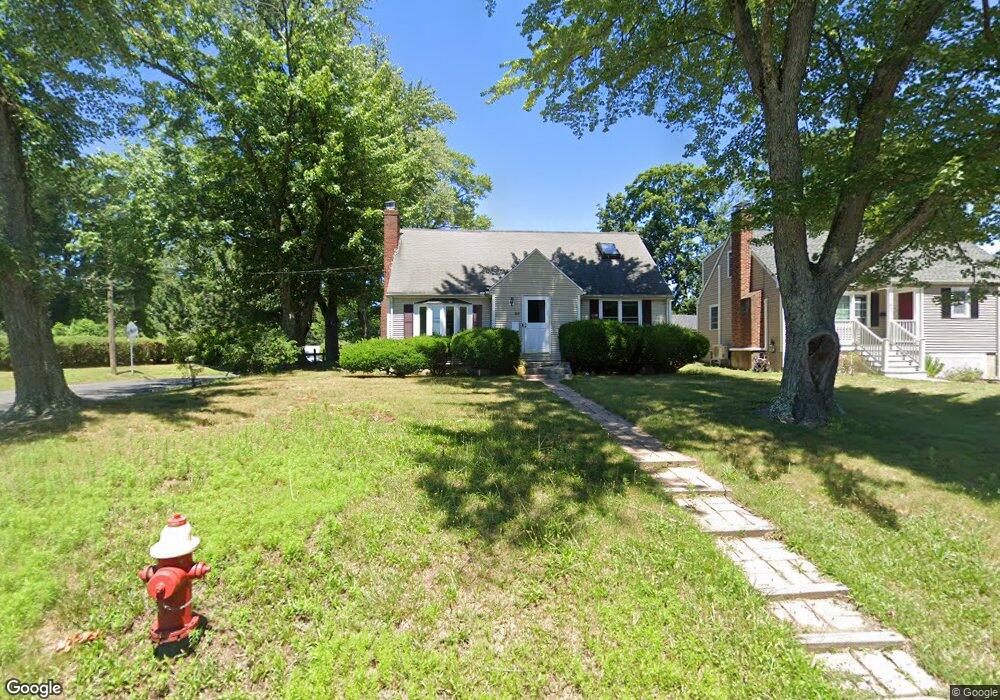
164 Tobey Ave Windsor, CT 06095
Estimated Value: $322,000 - $369,000
3
Beds
3
Baths
1,492
Sq Ft
$230/Sq Ft
Est. Value
About This Home
This home is located at 164 Tobey Ave, Windsor, CT 06095 and is currently estimated at $342,646, approximately $229 per square foot. 164 Tobey Ave is a home located in Hartford County with nearby schools including Poquonock Elementary School, Clover Street School, and Sage Park Middle School.
Ownership History
Date
Name
Owned For
Owner Type
Purchase Details
Closed on
Apr 16, 2003
Sold by
Harger Cindy
Bought by
Rodriguez Jennifer
Current Estimated Value
Home Financials for this Owner
Home Financials are based on the most recent Mortgage that was taken out on this home.
Original Mortgage
$131,900
Interest Rate
5.75%
Mortgage Type
Purchase Money Mortgage
Purchase Details
Closed on
Apr 20, 1998
Sold by
Balogh Frank and Reckitt Donna
Bought by
Harger Cindy
Home Financials for this Owner
Home Financials are based on the most recent Mortgage that was taken out on this home.
Original Mortgage
$113,241
Interest Rate
7.11%
Mortgage Type
Purchase Money Mortgage
Purchase Details
Closed on
Dec 16, 1992
Sold by
Arcari Thomas and Arcari Donna
Bought by
Balogh Frank and Reckitt Donna
Create a Home Valuation Report for This Property
The Home Valuation Report is an in-depth analysis detailing your home's value as well as a comparison with similar homes in the area
Home Values in the Area
Average Home Value in this Area
Purchase History
| Date | Buyer | Sale Price | Title Company |
|---|---|---|---|
| Rodriguez Jennifer | $164,900 | -- | |
| Harger Cindy | $113,500 | -- | |
| Balogh Frank | $134,500 | -- |
Source: Public Records
Mortgage History
| Date | Status | Borrower | Loan Amount |
|---|---|---|---|
| Open | Balogh Frank | $114,000 | |
| Closed | Balogh Frank | $131,900 | |
| Previous Owner | Balogh Frank | $128,000 | |
| Previous Owner | Balogh Frank | $113,241 |
Source: Public Records
Tax History Compared to Growth
Tax History
| Year | Tax Paid | Tax Assessment Tax Assessment Total Assessment is a certain percentage of the fair market value that is determined by local assessors to be the total taxable value of land and additions on the property. | Land | Improvement |
|---|---|---|---|---|
| 2025 | $5,863 | $206,080 | $52,500 | $153,580 |
| 2024 | $6,248 | $206,080 | $52,500 | $153,580 |
| 2023 | $4,351 | $129,500 | $41,790 | $87,710 |
| 2022 | $3,975 | $119,490 | $41,790 | $77,700 |
| 2021 | $3,975 | $119,490 | $41,790 | $77,700 |
| 2020 | $3,956 | $119,490 | $41,790 | $77,700 |
| 2019 | $3,869 | $119,490 | $41,790 | $77,700 |
| 2018 | $3,913 | $118,720 | $41,790 | $76,930 |
| 2017 | $3,852 | $118,720 | $41,790 | $76,930 |
| 2016 | $3,742 | $118,720 | $41,790 | $76,930 |
| 2015 | $3,671 | $118,720 | $41,790 | $76,930 |
| 2014 | $3,617 | $118,720 | $41,790 | $76,930 |
Source: Public Records
Map
Nearby Homes