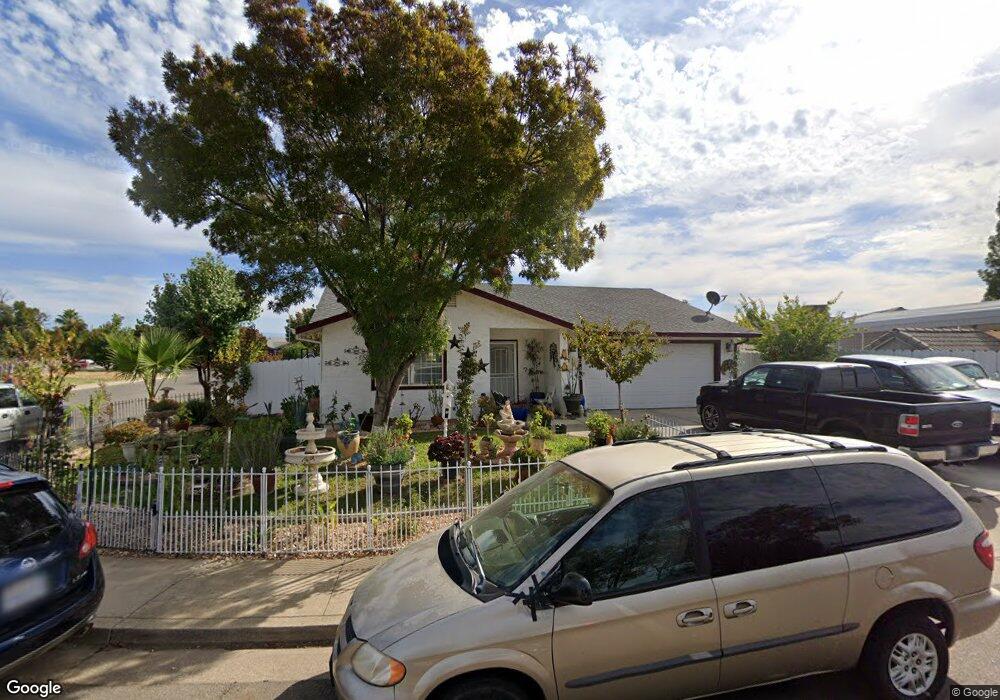
1640 Kemper Ave Red Bluff, CA 96080
Estimated Value: $245,000 - $292,000
3
Beds
2
Baths
1,161
Sq Ft
$237/Sq Ft
Est. Value
About This Home
This home is located at 1640 Kemper Ave, Red Bluff, CA 96080 and is currently estimated at $275,548, approximately $237 per square foot. 1640 Kemper Ave is a home located in Tehama County with nearby schools including Jackson Heights Elementary School, Vista Preparatory Academy, and Red Bluff High School.
Ownership History
Date
Name
Owned For
Owner Type
Purchase Details
Closed on
Mar 8, 2011
Sold by
Torres Ramon
Bought by
Torres Ramon and Torres Christian
Current Estimated Value
Purchase Details
Closed on
Mar 29, 2002
Sold by
Community Housing Improvement Program In
Bought by
Torres Ramon and Torres Maria S
Home Financials for this Owner
Home Financials are based on the most recent Mortgage that was taken out on this home.
Original Mortgage
$98,200
Outstanding Balance
$52,174
Interest Rate
6.78%
Mortgage Type
Construction
Estimated Equity
$223,374
Purchase Details
Closed on
Jul 31, 2001
Sold by
Standiford Larry L and Standiford Reta M
Bought by
Community Hsng Improvement Program Inc
Home Financials for this Owner
Home Financials are based on the most recent Mortgage that was taken out on this home.
Original Mortgage
$568,000
Interest Rate
7.05%
Create a Home Valuation Report for This Property
The Home Valuation Report is an in-depth analysis detailing your home's value as well as a comparison with similar homes in the area
Purchase History
| Date | Buyer | Sale Price | Title Company |
|---|---|---|---|
| Torres Ramon | -- | None Available | |
| Torres Ramon | $34,000 | Northern California Title Co | |
| Community Hsng Improvement Program Inc | $540,000 | Mid Valley Title & Escrow Co |
Source: Public Records
Mortgage History
| Date | Status | Borrower | Loan Amount |
|---|---|---|---|
| Open | Torres Ramon | $98,200 | |
| Previous Owner | Community Hsng Improvement Program Inc | $568,000 |
Source: Public Records
Tax History
| Year | Tax Paid | Tax Assessment Tax Assessment Total Assessment is a certain percentage of the fair market value that is determined by local assessors to be the total taxable value of land and additions on the property. | Land | Improvement |
|---|---|---|---|---|
| 2025 | $1,592 | $156,362 | $49,405 | $106,957 |
| 2023 | $1,565 | $150,292 | $47,488 | $102,804 |
| 2022 | $1,555 | $147,346 | $46,557 | $100,789 |
| 2021 | $1,492 | $144,458 | $45,645 | $98,813 |
| 2020 | $1,523 | $142,977 | $45,177 | $97,800 |
| 2019 | $1,465 | $133,941 | $42,226 | $91,715 |
| 2018 | $1,257 | $121,764 | $38,387 | $83,377 |
| 2017 | $1,176 | $110,694 | $34,897 | $75,797 |
| 2016 | $1,068 | $105,423 | $33,235 | $72,188 |
| 2015 | $1,067 | $105,423 | $33,235 | $72,188 |
| 2014 | $934 | $91,673 | $28,900 | $62,773 |
Source: Public Records
Map
Nearby Homes
- 1720 Luning St
- 1715 Walbridge St
- 1710 Luning St
- 1707 Luning St
- 1835 Douglass St
- 1500 Walbridge St
- 1570 Douglass St
- 1356 Park Ave
- 1359 2nd St
- 0 Derby Unit 24724349
- 1549 Jackson St
- 1426 Lincoln St
- 1313 Jackson St
- 106 Treasure Dr
- Lot D Aloe Place
- 605 Breckenridge St
- 147 Treasure Dr
- 920 Dumosa Dr
- 927 Cedar St
- 1158 Madison St
- 2250 Walbridge St
- 2205 Gentry Way
- 2320 Walbridge St
- 2330 Gentry Way
- 2195 Gentry Way
- 2240 Walbridge St
- 2192 Reta Way
- 2185 Gentry Way
- 1720 Kemper Ave
- 2230 Walbridge St
- 2340 Walbridge St
- 2190 Gentry Way
- 2235 Walbridge St
- 2182 Reta Way
- 2175 Gentry Way
- 2210 Walbridge St
- 1730 Kemper Ave
- 2225 Walbridge St
- 2172 Reta Way
- 2165 Gentry Way
Your Personal Tour Guide
Ask me questions while you tour the home.