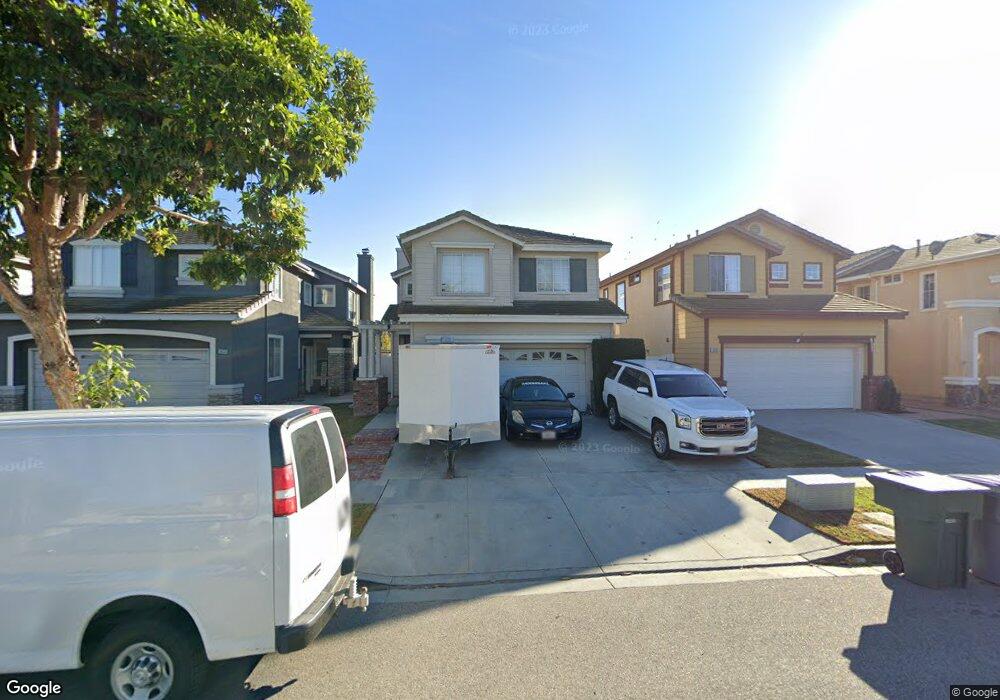
1640 Licho Way Oxnard, CA 93030
West Village NeighborhoodEstimated Value: $759,803 - $820,000
3
Beds
3
Baths
1,422
Sq Ft
$558/Sq Ft
Est. Value
About This Home
This home is located at 1640 Licho Way, Oxnard, CA 93030 and is currently estimated at $793,701, approximately $558 per square foot. 1640 Licho Way is a home located in Ventura County with nearby schools including Brekke Elementary School, R.J. Frank Academy of Marine Science & Engineering, and Pacifica High School.
Ownership History
Date
Name
Owned For
Owner Type
Purchase Details
Closed on
May 13, 2002
Sold by
Ramos Jose J and Maye Ramos Natalie W
Bought by
Ramos Jose J and Maye Ramos Natalie W
Current Estimated Value
Home Financials for this Owner
Home Financials are based on the most recent Mortgage that was taken out on this home.
Original Mortgage
$185,000
Outstanding Balance
$78,174
Interest Rate
6.94%
Estimated Equity
$715,527
Purchase Details
Closed on
Nov 8, 1999
Sold by
Standard Pacific Corp
Bought by
Ramos Jose J and Maye Natalie W
Home Financials for this Owner
Home Financials are based on the most recent Mortgage that was taken out on this home.
Original Mortgage
$162,100
Interest Rate
7.95%
Create a Home Valuation Report for This Property
The Home Valuation Report is an in-depth analysis detailing your home's value as well as a comparison with similar homes in the area
Home Values in the Area
Average Home Value in this Area
Purchase History
| Date | Buyer | Sale Price | Title Company |
|---|---|---|---|
| Ramos Jose J | -- | Lawyers Title Company | |
| Ramos Jose J | $167,500 | First American Title Ins Co |
Source: Public Records
Mortgage History
| Date | Status | Borrower | Loan Amount |
|---|---|---|---|
| Open | Ramos Jose J | $185,000 | |
| Closed | Ramos Jose J | $162,100 | |
| Closed | Ramos Jose J | $5,000 |
Source: Public Records
Tax History
| Year | Tax Paid | Tax Assessment Tax Assessment Total Assessment is a certain percentage of the fair market value that is determined by local assessors to be the total taxable value of land and additions on the property. | Land | Improvement |
|---|---|---|---|---|
| 2025 | $3,820 | $275,248 | $102,738 | $172,510 |
| 2024 | $3,820 | $269,851 | $100,723 | $169,128 |
| 2023 | $3,396 | $264,560 | $98,748 | $165,812 |
| 2022 | $3,120 | $259,373 | $96,812 | $162,561 |
| 2021 | $3,323 | $254,288 | $94,914 | $159,374 |
| 2020 | $3,380 | $251,683 | $93,942 | $157,741 |
| 2019 | $3,236 | $246,749 | $92,100 | $154,649 |
| 2018 | $3,049 | $241,912 | $90,295 | $151,617 |
| 2017 | $2,811 | $237,170 | $88,525 | $148,645 |
| 2016 | $2,912 | $232,521 | $86,790 | $145,731 |
| 2015 | $3,124 | $229,031 | $85,488 | $143,543 |
| 2014 | $3,092 | $224,546 | $83,814 | $140,732 |
Source: Public Records
Map
Nearby Homes
- 565 Rosalinda Dr
- 1902 Ribera Dr Unit 86
- 1930 Ribera Dr
- 2030 Ocaso Place
- 211 Featherstone St
- 902 Paseo Brisas Lindas
- 136 S Roosevelt Ave
- 400 N Hayes Ave
- 403 E 2nd St
- 255 Douglas Ave
- 246 Doris Ave
- 208 Bolero Ln
- 411 Eastwood Dr
- 450 W Roderick Ave
- 209 Lafayette Dr
- 800 S A St
- 425 W 1st St
- 2012 Blackberry Cir
- 2016 Blackberry Cir
- 633 Meta St
Your Personal Tour Guide
Ask me questions while you tour the home.