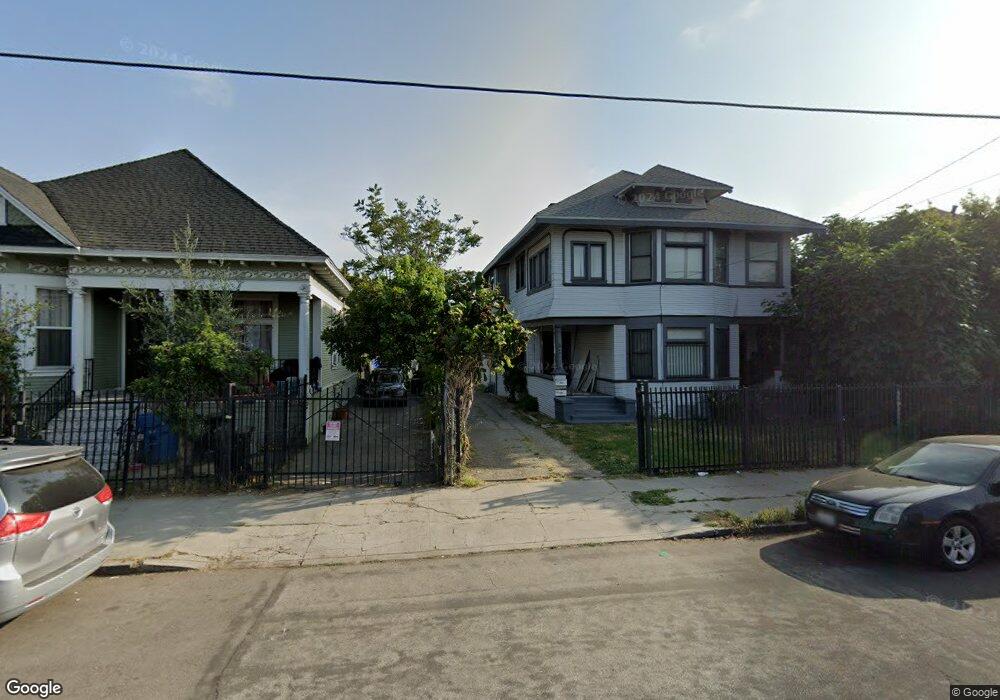
1640 W 12th Place Los Angeles, CA 90015
Pico-Union NeighborhoodEstimated Value: $1,004,000 - $1,680,000
4
Beds
2
Baths
3,660
Sq Ft
$336/Sq Ft
Est. Value
About This Home
This home is located at 1640 W 12th Place, Los Angeles, CA 90015 and is currently estimated at $1,228,665, approximately $335 per square foot. 1640 W 12th Place is a home located in Los Angeles County with nearby schools including Tenth Street Elementary School, John H. Liechty Middle School, and Belmont High School.
Ownership History
Date
Name
Owned For
Owner Type
Purchase Details
Closed on
Jan 27, 2020
Sold by
Hwang Jeff Sun and Whang Jip Sun
Bought by
Hwang Jeff Sun and Shin Eun Hye
Current Estimated Value
Home Financials for this Owner
Home Financials are based on the most recent Mortgage that was taken out on this home.
Original Mortgage
$455,000
Outstanding Balance
$403,634
Interest Rate
3.7%
Mortgage Type
New Conventional
Estimated Equity
$825,031
Purchase Details
Closed on
Feb 25, 2003
Sold by
Chun Hojoon
Bought by
Whang Jip Sun
Home Financials for this Owner
Home Financials are based on the most recent Mortgage that was taken out on this home.
Original Mortgage
$280,000
Interest Rate
5.85%
Purchase Details
Closed on
Oct 9, 2002
Sold by
Lam Betty Fong
Bought by
Chun Hojoon
Home Financials for this Owner
Home Financials are based on the most recent Mortgage that was taken out on this home.
Original Mortgage
$202,500
Interest Rate
5.5%
Create a Home Valuation Report for This Property
The Home Valuation Report is an in-depth analysis detailing your home's value as well as a comparison with similar homes in the area
Home Values in the Area
Average Home Value in this Area
Purchase History
| Date | Buyer | Sale Price | Title Company |
|---|---|---|---|
| Hwang Jeff Sun | -- | Wfg National Title Company | |
| Whang Jip Sun | $350,000 | Fatcola | |
| Chun Hojoon | $225,000 | Investors Title |
Source: Public Records
Mortgage History
| Date | Status | Borrower | Loan Amount |
|---|---|---|---|
| Open | Hwang Jeff Sun | $455,000 | |
| Closed | Whang Jip Sun | $280,000 | |
| Previous Owner | Chun Hojoon | $202,500 | |
| Closed | Whang Jip Sun | $35,000 |
Source: Public Records
Tax History Compared to Growth
Tax History
| Year | Tax Paid | Tax Assessment Tax Assessment Total Assessment is a certain percentage of the fair market value that is determined by local assessors to be the total taxable value of land and additions on the property. | Land | Improvement |
|---|---|---|---|---|
| 2025 | $6,383 | $506,895 | $362,075 | $144,820 |
| 2024 | $6,383 | $496,957 | $354,976 | $141,981 |
| 2023 | $6,268 | $487,214 | $348,016 | $139,198 |
| 2022 | $5,991 | $477,662 | $341,193 | $136,469 |
| 2021 | $5,896 | $468,297 | $334,503 | $133,794 |
| 2020 | $5,949 | $463,497 | $331,074 | $132,423 |
| 2019 | $5,725 | $454,410 | $324,583 | $129,827 |
| 2018 | $5,601 | $445,501 | $318,219 | $127,282 |
| 2016 | $5,322 | $428,204 | $305,863 | $122,341 |
| 2015 | $5,246 | $421,773 | $301,269 | $120,504 |
| 2014 | $5,274 | $413,512 | $295,368 | $118,144 |
Source: Public Records
Map
Nearby Homes
- 1833 W Pico Blvd
- 1238 S Bonnie Brae St
- 1631 W 11th Place
- 1835 W 12th St
- 1328 Constance St
- 1340 Constance St
- 1820 W 11th St
- 2006 W 12th St
- 1050 S Bonnie Brae St
- 1324 S Westlake Ave
- 1311 S Westlake Ave
- 1118 Valencia St Unit 113
- 1119 Albany St Unit 235
- 1119 Albany St Unit 225
- 1119 Albany St Unit 226
- 1118 Valencia St Unit 120
- 1037 S Bonnie Brae St
- 1052 S Westlake Ave
- 1046 S Westlake Ave
- 1040 S Westlake Ave
- 1638 W 12th Place
- 1648 W 12th Place
- 1650 W 12th Place
- 1654 W 12th Place
- 1647 W 12th Place Unit 4
- 1647 W 12th Place Unit 1
- 1647 W 12th Place Unit 7
- 1647 W 12th Place
- 1637 W 12th Place
- 1622 W 12th Place
- 1664 W 12th Place Unit A
- 1664 W 12th Place
- 1633 W 12th Place
- 1657 W 12th Place
- 1627 W Pico Blvd
- 1618 W 12th Place
- 1623 W 12th Place
- 1663 W 12th Place
- 1670 W 12th Place
- 1640 W 12th St