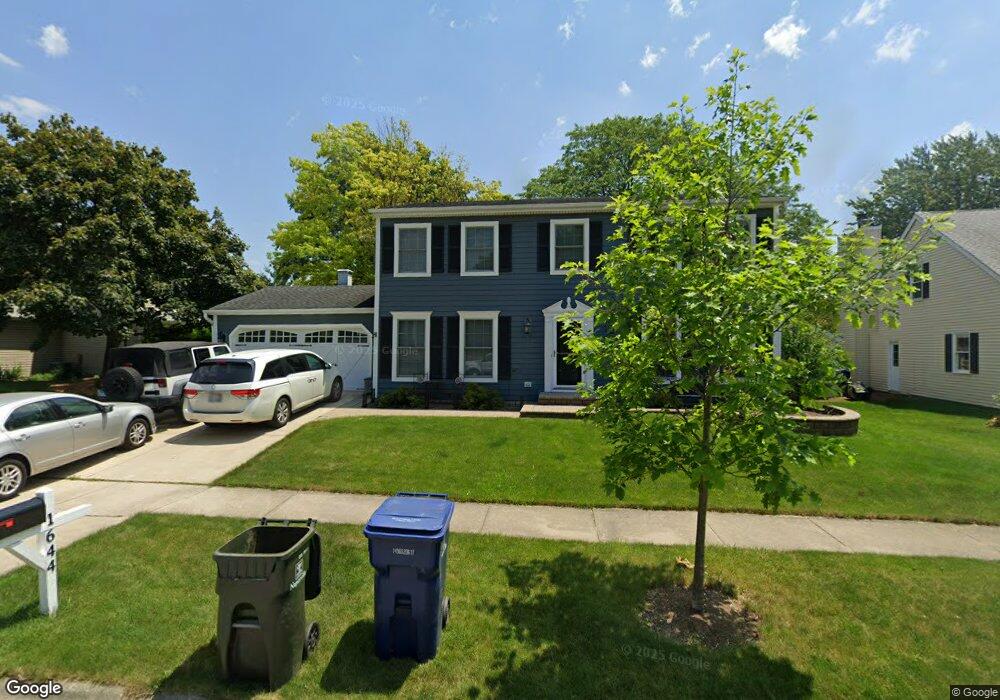
1644 Dartmouth Ct Naperville, IL 60565
Ranch View NeighborhoodEstimated Value: $544,573 - $659,000
--
Bed
1
Bath
2,185
Sq Ft
$281/Sq Ft
Est. Value
About This Home
This home is located at 1644 Dartmouth Ct, Naperville, IL 60565 and is currently estimated at $613,643, approximately $280 per square foot. 1644 Dartmouth Ct is a home located in DuPage County with nearby schools including Ranch View Elementary School, Kennedy Junior High School, and Naperville Central High School.
Ownership History
Date
Name
Owned For
Owner Type
Purchase Details
Closed on
Dec 26, 2000
Sold by
Kolanowski Stephen J and Kolanowski Jodee J
Bought by
Johnson Steven D and Johnson Ann Marie
Current Estimated Value
Home Financials for this Owner
Home Financials are based on the most recent Mortgage that was taken out on this home.
Original Mortgage
$200,000
Outstanding Balance
$74,007
Interest Rate
7.58%
Estimated Equity
$539,636
Purchase Details
Closed on
Sep 29, 1998
Sold by
Hornstra Gary L and Hornstra Janet L
Bought by
Kolanowski Stephen J and Kolanowski Jodee J
Home Financials for this Owner
Home Financials are based on the most recent Mortgage that was taken out on this home.
Original Mortgage
$147,000
Interest Rate
6.9%
Create a Home Valuation Report for This Property
The Home Valuation Report is an in-depth analysis detailing your home's value as well as a comparison with similar homes in the area
Home Values in the Area
Average Home Value in this Area
Purchase History
| Date | Buyer | Sale Price | Title Company |
|---|---|---|---|
| Johnson Steven D | $285,000 | First American Title Ins | |
| Kolanowski Stephen J | $222,000 | -- |
Source: Public Records
Mortgage History
| Date | Status | Borrower | Loan Amount |
|---|---|---|---|
| Open | Johnson Steven D | $200,000 | |
| Previous Owner | Kolanowski Stephen J | $147,000 |
Source: Public Records
Tax History Compared to Growth
Tax History
| Year | Tax Paid | Tax Assessment Tax Assessment Total Assessment is a certain percentage of the fair market value that is determined by local assessors to be the total taxable value of land and additions on the property. | Land | Improvement |
|---|---|---|---|---|
| 2024 | $9,304 | $159,874 | $57,075 | $102,799 |
| 2023 | $8,961 | $145,910 | $52,090 | $93,820 |
| 2022 | $8,437 | $136,360 | $48,680 | $87,680 |
| 2021 | $8,127 | $131,200 | $46,840 | $84,360 |
| 2020 | $7,953 | $128,840 | $46,000 | $82,840 |
| 2019 | $7,719 | $123,270 | $44,010 | $79,260 |
| 2018 | $7,721 | $123,270 | $44,010 | $79,260 |
| 2017 | $7,565 | $119,120 | $42,530 | $76,590 |
| 2016 | $7,411 | $114,810 | $40,990 | $73,820 |
| 2015 | $7,361 | $108,120 | $38,600 | $69,520 |
| 2014 | $7,110 | $101,520 | $36,240 | $65,280 |
| 2013 | $7,004 | $101,770 | $36,330 | $65,440 |
Source: Public Records
Map
Nearby Homes
- 1340 Auburn Ave
- 1323 Auburn Ave
- 1896 Appaloosa Dr Unit 7
- 1572 Clemson Dr
- 1519 77th St
- 1717 Drake Ct
- 1877 Appaloosa Dr
- 1817 Appaloosa Dr
- 1924 Vassar Dr Unit 11
- 1643 Estate Cir
- 1622 Indian Knoll Rd
- 1625 Indian Knoll Rd
- 614 Bakewell Ln
- 1216 Tranquility Ct
- 456 Timber Trail Ct
- 621 Bourbon Ct
- 1449 Whitespire Ct Unit 5104
- 877 Wescott Rd
- 816 Spindletree Ave
- 431 Orleans Ave
- 1592 Marquette Ave
- 1648 Dartmouth Ct
- 1653 Kenyon Dr
- 1598 Marquette Ave
- 1657 Kenyon Dr
- 1641 Dartmouth Ct
- 1649 Dartmouth Ct
- 1652 Dartmouth Ct
- 1593 Marquette Ave
- 1580 Marquette Ave
- 1589 Marquette Ave
- 1585 Marquette Ave
- 1657 Dartmouth Ct
- 1521 Clarkson Ct
- 1656 Dartmouth Ct
- 1529 Clarkson Ct
- 1641 Kenyon Dr
- 1525 Clarkson Ct
- 1654 Kenyon Dr
- 1581 Marquette Ave