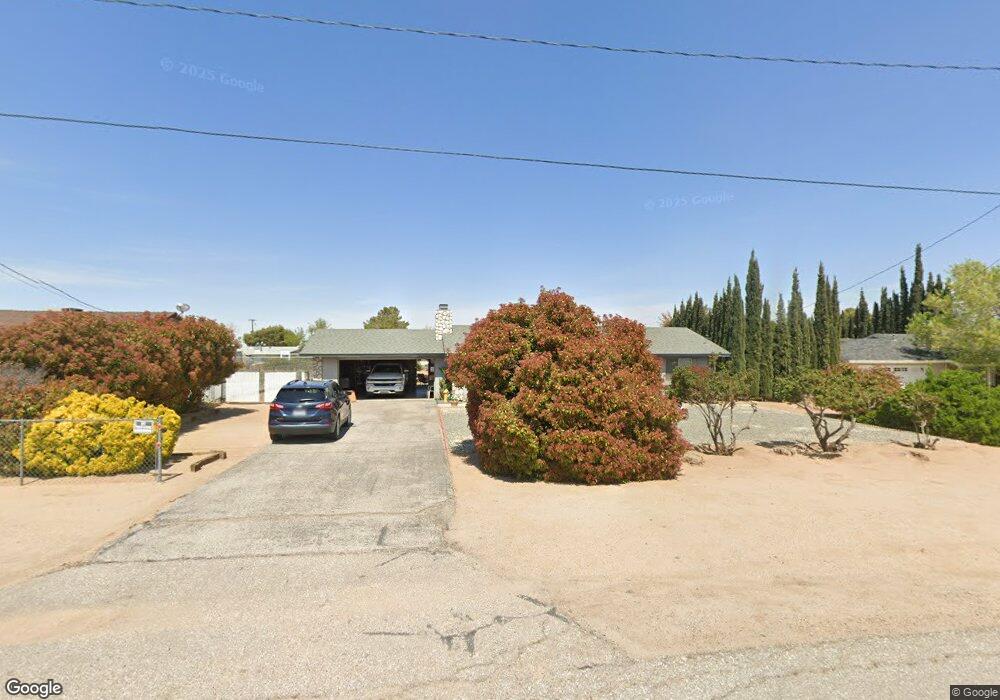
16440 Sage St Hesperia, CA 92345
The Mesa NeighborhoodEstimated Value: $392,230 - $439,000
3
Beds
2
Baths
1,170
Sq Ft
$358/Sq Ft
Est. Value
About This Home
This home is located at 16440 Sage St, Hesperia, CA 92345 and is currently estimated at $418,558, approximately $357 per square foot. 16440 Sage St is a home located in San Bernardino County with nearby schools including Lime Street Elementary School, Ranchero Middle School, and Sultana High School.
Ownership History
Date
Name
Owned For
Owner Type
Purchase Details
Closed on
Dec 18, 2009
Sold by
Johnson Ann Teresa
Bought by
Johnson Mark C
Current Estimated Value
Purchase Details
Closed on
Oct 7, 2004
Sold by
Johnson Mark C
Bought by
Johnson Mark C
Home Financials for this Owner
Home Financials are based on the most recent Mortgage that was taken out on this home.
Original Mortgage
$68,500
Interest Rate
5.72%
Mortgage Type
New Conventional
Purchase Details
Closed on
Jul 21, 1998
Sold by
Johnson Donna J
Bought by
Johnson Mark C
Create a Home Valuation Report for This Property
The Home Valuation Report is an in-depth analysis detailing your home's value as well as a comparison with similar homes in the area
Home Values in the Area
Average Home Value in this Area
Purchase History
| Date | Buyer | Sale Price | Title Company |
|---|---|---|---|
| Johnson Mark C | -- | None Available | |
| Johnson Mark C | -- | Nations | |
| Johnson Mark C | -- | -- |
Source: Public Records
Mortgage History
| Date | Status | Borrower | Loan Amount |
|---|---|---|---|
| Closed | Johnson Mark C | $68,500 |
Source: Public Records
Tax History Compared to Growth
Tax History
| Year | Tax Paid | Tax Assessment Tax Assessment Total Assessment is a certain percentage of the fair market value that is determined by local assessors to be the total taxable value of land and additions on the property. | Land | Improvement |
|---|---|---|---|---|
| 2025 | $1,488 | $138,677 | $35,466 | $103,211 |
| 2024 | $1,488 | $135,958 | $34,771 | $101,187 |
| 2023 | $1,470 | $133,292 | $34,089 | $99,203 |
| 2022 | $1,436 | $130,679 | $33,421 | $97,258 |
| 2021 | $1,409 | $128,117 | $32,766 | $95,351 |
| 2020 | $1,392 | $126,803 | $32,430 | $94,373 |
| 2019 | $1,363 | $124,317 | $31,794 | $92,523 |
| 2018 | $1,336 | $121,880 | $31,171 | $90,709 |
| 2017 | $1,312 | $119,490 | $30,560 | $88,930 |
| 2016 | $1,283 | $117,147 | $29,961 | $87,186 |
| 2015 | $1,266 | $115,387 | $29,511 | $85,876 |
| 2014 | $1,248 | $113,127 | $28,933 | $84,194 |
Source: Public Records
Map
Nearby Homes