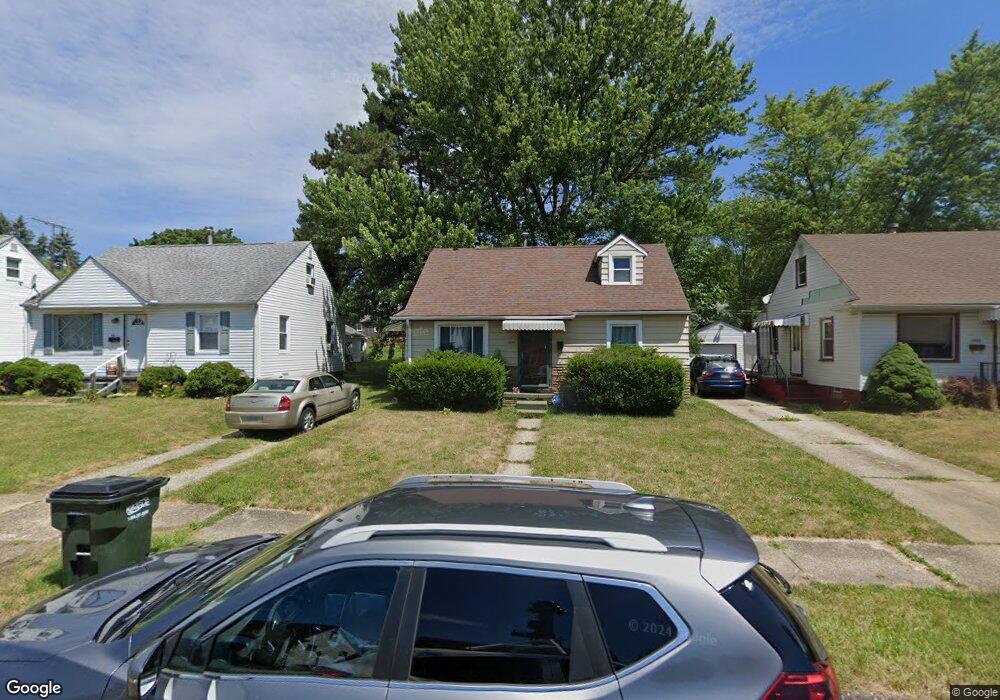
1645 32nd St NE Canton, OH 44714
Plain Township NeighborhoodEstimated Value: $120,080 - $144,000
3
Beds
1
Bath
1,104
Sq Ft
$122/Sq Ft
Est. Value
About This Home
This home is located at 1645 32nd St NE, Canton, OH 44714 and is currently estimated at $134,520, approximately $121 per square foot. 1645 32nd St NE is a home located in Stark County with nearby schools including Frazer Elementary School, Glenwood Intermediate School, and GlenOak High School.
Ownership History
Date
Name
Owned For
Owner Type
Purchase Details
Closed on
Dec 13, 2007
Sold by
Defrank Lynne M
Bought by
Defrank Thomas B
Current Estimated Value
Purchase Details
Closed on
May 28, 2003
Sold by
Defrank Thomas B
Bought by
Defrank Thomas B and Defrank Lynne M
Purchase Details
Closed on
Apr 29, 2003
Sold by
Defrank Nicole L
Bought by
Defrank Thomas B
Purchase Details
Closed on
Oct 28, 2000
Sold by
Vincent Tonielli
Bought by
Defrank Thomas B and Defrank Nicole L
Home Financials for this Owner
Home Financials are based on the most recent Mortgage that was taken out on this home.
Original Mortgage
$73,924
Interest Rate
7.9%
Mortgage Type
FHA
Create a Home Valuation Report for This Property
The Home Valuation Report is an in-depth analysis detailing your home's value as well as a comparison with similar homes in the area
Home Values in the Area
Average Home Value in this Area
Purchase History
| Date | Buyer | Sale Price | Title Company |
|---|---|---|---|
| Defrank Thomas B | -- | None Available | |
| Defrank Thomas B | -- | -- | |
| Defrank Thomas B | -- | -- | |
| Defrank Thomas B | $74,900 | -- |
Source: Public Records
Mortgage History
| Date | Status | Borrower | Loan Amount |
|---|---|---|---|
| Previous Owner | Defrank Thomas B | $73,924 |
Source: Public Records
Tax History Compared to Growth
Tax History
| Year | Tax Paid | Tax Assessment Tax Assessment Total Assessment is a certain percentage of the fair market value that is determined by local assessors to be the total taxable value of land and additions on the property. | Land | Improvement |
|---|---|---|---|---|
| 2025 | -- | $30,980 | $8,260 | $22,720 |
| 2024 | -- | $30,980 | $8,260 | $22,720 |
| 2023 | $1,118 | $23,980 | $7,210 | $16,770 |
| 2022 | $1,126 | $23,980 | $7,210 | $16,770 |
| 2021 | $1,131 | $23,980 | $7,210 | $16,770 |
| 2020 | $1,064 | $20,520 | $6,200 | $14,320 |
| 2019 | $1,055 | $20,520 | $6,200 | $14,320 |
| 2018 | $1,042 | $20,520 | $6,200 | $14,320 |
| 2017 | $1,009 | $18,240 | $6,130 | $12,110 |
| 2016 | $1,015 | $18,310 | $6,130 | $12,180 |
| 2015 | $981 | $18,310 | $6,130 | $12,180 |
| 2014 | $1,501 | $17,540 | $5,880 | $11,660 |
| 2013 | $471 | $17,540 | $5,880 | $11,660 |
Source: Public Records
Map
Nearby Homes
- 1624 34th St NE
- 1227 33rd St NE
- 1306 Milford St NE
- 1233 29th St NE
- 000 Rowland Ave NE
- 3321 Martindale Rd NE
- 1638 Warrick Place NE
- 1321 Warrick Place NE
- 1202 28th St NE
- 3022 Taft Ave NE
- 1912 40th St NE
- 2333 Ivy Way St NE
- 2510 Gross Ave NE
- 4015 Pelham St NE Unit 3A
- 1115 Colonial Blvd NE
- 1007 27th St NE
- 808 29th St NE
- 708 29th St NE
- 2315 Maple Ave NE
- 1220 25th St NE
- 1651 32nd St NE
- 1641 32nd St NE
- 1655 32nd St NE
- 1635 32nd St NE
- 1631 32nd St NE
- 1640 33rd St NE
- 1634 33rd St NE
- 1701 32nd St NE
- 1627 32nd St NE
- 1644 32nd St NE
- 1650 32nd St NE
- 1640 32nd St NE
- 1630 33rd St NE
- 3121 Maple Ave NE
- 1636 32nd St NE
- 1626 33rd St NE
- 1707 32nd St NE
- 1621 32nd St NE
- 1630 32nd St NE
- 1700 32nd St NE