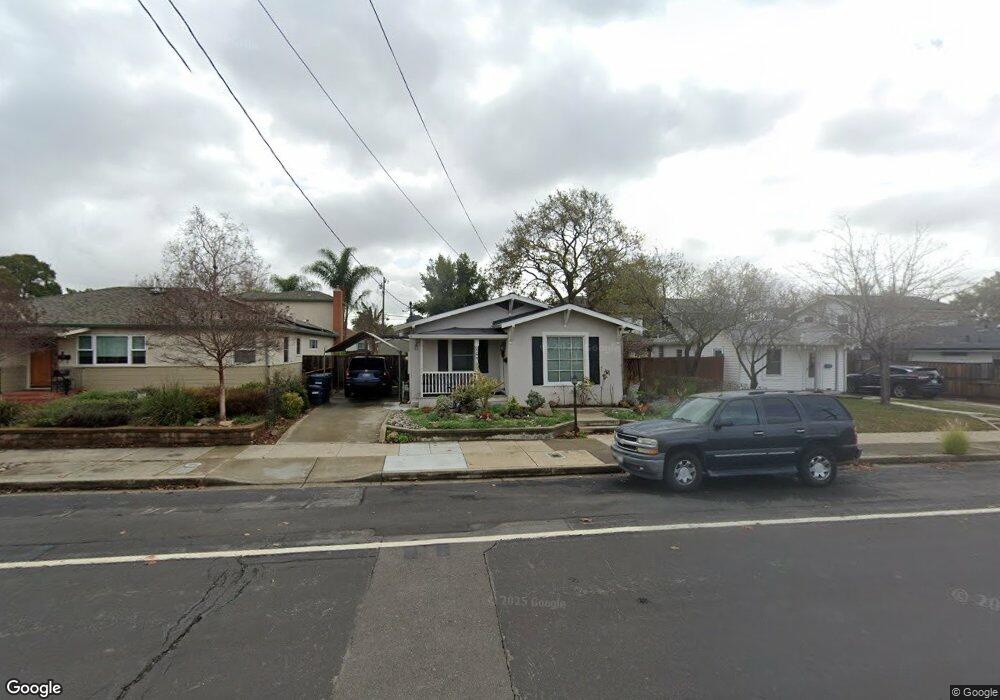
1645 3rd St Livermore, CA 94550
Downtown Livermore NeighborhoodEstimated Value: $734,907 - $987,000
1
Bed
1
Bath
838
Sq Ft
$1,032/Sq Ft
Est. Value
About This Home
This home is located at 1645 3rd St, Livermore, CA 94550 and is currently estimated at $864,477, approximately $1,031 per square foot. 1645 3rd St is a home located in Alameda County with nearby schools including Junction Avenue K-8 School, Livermore High School, and St Michael's School.
Ownership History
Date
Name
Owned For
Owner Type
Purchase Details
Closed on
Jul 26, 2016
Sold by
Maultsby Rita C
Bought by
Janzen Julie L
Current Estimated Value
Home Financials for this Owner
Home Financials are based on the most recent Mortgage that was taken out on this home.
Original Mortgage
$265,000
Outstanding Balance
$211,848
Interest Rate
3.54%
Mortgage Type
New Conventional
Estimated Equity
$652,629
Purchase Details
Closed on
May 3, 2007
Sold by
Powers Jacqueline
Bought by
Maultsby Rita C
Home Financials for this Owner
Home Financials are based on the most recent Mortgage that was taken out on this home.
Original Mortgage
$388,000
Interest Rate
6.17%
Mortgage Type
Purchase Money Mortgage
Purchase Details
Closed on
Jun 9, 2004
Sold by
Foscalina Neil W
Bought by
Powers Jacqueline
Home Financials for this Owner
Home Financials are based on the most recent Mortgage that was taken out on this home.
Original Mortgage
$312,000
Interest Rate
6.25%
Mortgage Type
Purchase Money Mortgage
Create a Home Valuation Report for This Property
The Home Valuation Report is an in-depth analysis detailing your home's value as well as a comparison with similar homes in the area
Home Values in the Area
Average Home Value in this Area
Purchase History
| Date | Buyer | Sale Price | Title Company |
|---|---|---|---|
| Janzen Julie L | $575,000 | Old Republic Title Company | |
| Maultsby Rita C | $485,000 | Chicago Title Co | |
| Powers Jacqueline | $390,000 | Alliance Title Company |
Source: Public Records
Mortgage History
| Date | Status | Borrower | Loan Amount |
|---|---|---|---|
| Open | Janzen Julie L | $265,000 | |
| Previous Owner | Maultsby Rita C | $388,000 | |
| Previous Owner | Powers Jacqueline | $312,000 | |
| Closed | Powers Jacqueline | $78,000 |
Source: Public Records
Tax History
| Year | Tax Paid | Tax Assessment Tax Assessment Total Assessment is a certain percentage of the fair market value that is determined by local assessors to be the total taxable value of land and additions on the property. | Land | Improvement |
|---|---|---|---|---|
| 2025 | $8,493 | $660,321 | $301,745 | $365,576 |
| 2024 | $8,493 | $647,240 | $295,830 | $358,410 |
| 2023 | $8,365 | $641,412 | $290,030 | $351,382 |
| 2022 | $8,243 | $621,836 | $284,343 | $344,493 |
| 2021 | $7,332 | $609,508 | $278,769 | $337,739 |
| 2020 | $7,839 | $610,190 | $275,912 | $334,278 |
| 2019 | $7,871 | $598,230 | $270,504 | $327,726 |
| 2018 | $7,702 | $586,500 | $265,200 | $321,300 |
| 2017 | $7,504 | $575,000 | $260,000 | $315,000 |
| 2016 | $6,070 | $463,491 | $139,047 | $324,444 |
| 2015 | $4,968 | $390,000 | $117,000 | $273,000 |
| 2014 | $4,247 | $325,000 | $97,500 | $227,500 |
Source: Public Records
Map
Nearby Homes
- 1766 College Ave
- 170 N N St Unit 102
- 157 Zephyr Place Unit 109
- 1725 Pedrozzi Common
- 1718 Pedrozzi Common
- 1085 Murrieta Blvd Unit 222
- 1085 Murrieta Blvd Unit 124
- 1085 Murrieta Blvd Unit 318
- 1085 Murrieta Blvd Unit 324
- 1087 Murrieta Blvd Unit 243
- 1087 Murrieta Blvd Unit 130
- 1087 Murrieta Blvd Unit 242
- 2235 4th St
- 1277 Olivina Ave
- 2155 Chestnut St
- 350 N K St
- 2211 College Ave
- 974 Ventura Ave
- 975 Murrieta Blvd
- 961 Lambaren Ave
Your Personal Tour Guide
Ask me questions while you tour the home.