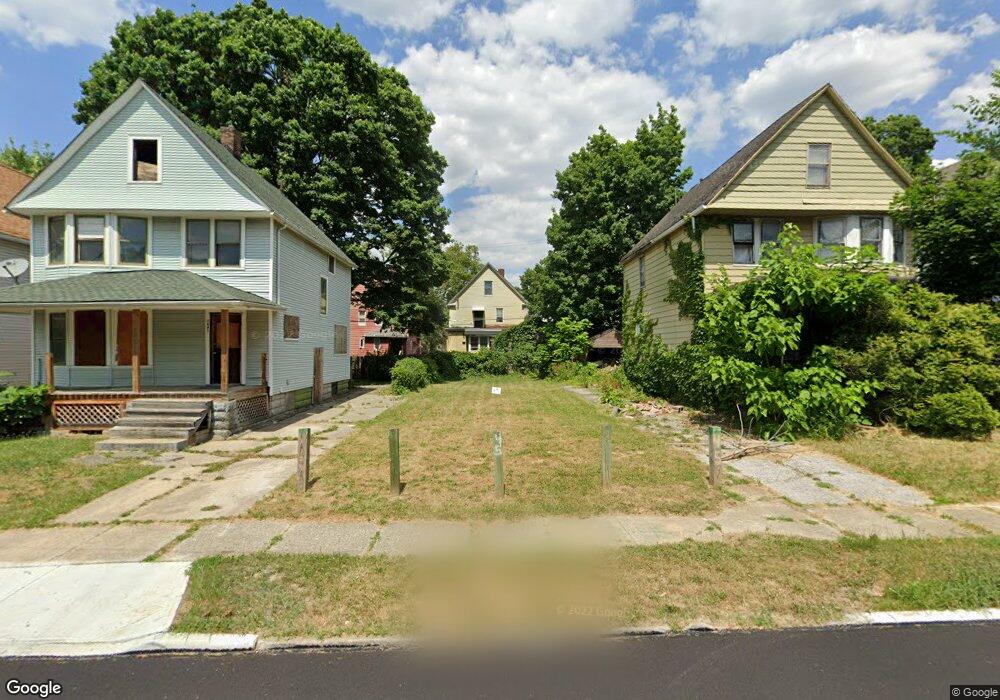
1645 Delmont Ave Cleveland, OH 44112
Estimated Value: $57,000
3
Beds
1
Bath
1,272
Sq Ft
$45/Sq Ft
Est. Value
About This Home
This home is located at 1645 Delmont Ave, Cleveland, OH 44112 and is currently priced at $57,000, approximately $44 per square foot. 1645 Delmont Ave is a home located in Cuyahoga County with nearby schools including Shaw High School, Cleveland Montessori, and Montessori High School at University Circle.
Ownership History
Date
Name
Owned For
Owner Type
Purchase Details
Closed on
Jun 12, 2024
Sold by
Cuyahoga Cnty Land Reutilizati
Bought by
City/E Cleveland Land Reutiliz
Current Estimated Value
Purchase Details
Closed on
Mar 15, 2017
Sold by
Cuyahoiga County Land Reutilization
Bought by
Nyset5h Vanda
Purchase Details
Closed on
May 8, 2015
Sold by
Deboer Taunya Helene
Bought by
Nyseth Vanda
Purchase Details
Closed on
Dec 28, 2007
Sold by
Best Buy Properties Inc
Bought by
Deboer Taunya Helene
Purchase Details
Closed on
Sep 19, 2007
Sold by
Deutsche Bank National Trust Co
Bought by
Best Buy Properties Inc
Purchase Details
Closed on
Jan 11, 2007
Sold by
Brewster Debra A
Bought by
Deutsche Bank National Trust Co and Gsamp Trust 2002 He2 Mortgage Pass Throu
Purchase Details
Closed on
Feb 27, 1984
Sold by
Blevins Mary M
Bought by
Brewster Debra A
Purchase Details
Closed on
Jan 1, 1975
Bought by
Helstein Edward and Helstein Rosalind
Create a Home Valuation Report for This Property
The Home Valuation Report is an in-depth analysis detailing your home's value as well as a comparison with similar homes in the area
Home Values in the Area
Average Home Value in this Area
Purchase History
| Date | Buyer | Sale Price | Title Company |
|---|---|---|---|
| City/E Cleveland Land Reutiliz | -- | None Listed On Document | |
| Nyset5h Vanda | -- | None Available | |
| Nyseth Vanda | -- | Titleco Title Agency Ltd | |
| Deboer Taunya Helene | $5,900 | None Available | |
| Best Buy Properties Inc | $2,000 | Multiple | |
| Deutsche Bank National Trust Co | $25,334 | Attorney | |
| Brewster Debra A | $12,000 | -- | |
| Blevins Mary M | $12,000 | -- | |
| Helstein Edward | -- | -- |
Source: Public Records
Tax History Compared to Growth
Tax History
| Year | Tax Paid | Tax Assessment Tax Assessment Total Assessment is a certain percentage of the fair market value that is determined by local assessors to be the total taxable value of land and additions on the property. | Land | Improvement |
|---|---|---|---|---|
| 2024 | -- | $700 | $700 | -- |
| 2022 | $87 | $2,520 | $2,520 | $0 |
| 2021 | $87 | $2,520 | $2,520 | $0 |
| 2020 | $87 | $2,520 | $2,520 | $0 |
| 2019 | $124 | $0 | $0 | $0 |
| 2018 | $124 | $2,520 | $2,520 | $0 |
| 2017 | $110 | $0 | $0 | $0 |
| 2016 | $638 | $5,950 | $2,520 | $3,430 |
| 2015 | -- | $5,950 | $2,520 | $3,430 |
| 2014 | -- | $7,010 | $2,980 | $4,030 |
Source: Public Records
Map
Nearby Homes
- 1333 E 124th St
- 1679 Lockwood Ave
- 1358 E 123rd St
- 1423 E 120th St
- 1515 E 123rd St
- 1229 Melbourne Rd
- 1217 E 125th St
- 1510 E 123rd St
- 1445 E 118th St
- 1353 E 117th St
- 1497 E 120th St Unit 5
- 1200 E 125th St
- 1827 Idlewood Ave
- 1184 Melbourne Rd
- 12208 Ingomar Ave
- 1855 Woodlawn Ave
- 1858 Woodlawn Ave
- 1467 E 116th St
- 1198 Rozelle Ave
- 1317 E 115th St
- 1647 Delmont Ave
- 1641 Delmont Ave
- 1639 Delmont Ave
- 1651 Delmont Ave
- 1635 Delmont Ave
- 1655 Delmont Ave
- 1644 Elberon Ave
- 1640 Elberon Ave
- 1648 Elberon Ave
- 1642 Delmont Ave
- 1648 Delmont Ave
- 1638 Delmont Ave
- 1636 Elberon Ave
- 1652 Elberon Ave
- 1634 Delmont Ave
- 1632 Elberon Ave
- 1656 Elberon Ave
- 1630 Delmont Ave
- 1663 Delmont Ave
- 1628 Elberon Ave