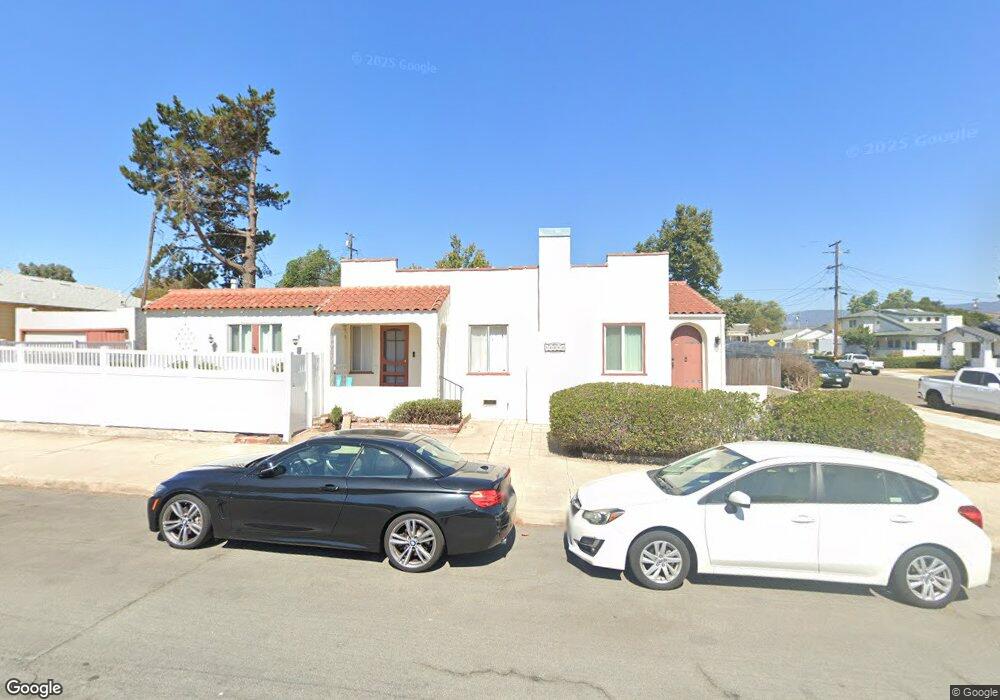
1645 Nipomo St San Luis Obispo, CA 93401
Downtown San Luis Obispo NeighborhoodEstimated Value: $933,000 - $1,263,000
2
Beds
1
Bath
1,278
Sq Ft
$836/Sq Ft
Est. Value
About This Home
This home is located at 1645 Nipomo St, San Luis Obispo, CA 93401 and is currently estimated at $1,068,766, approximately $836 per square foot. 1645 Nipomo St is a home located in San Luis Obispo County with nearby schools including Laguna Middle School, San Luis Obispo High School, and San Luis Obispo Classical Academy.
Ownership History
Date
Name
Owned For
Owner Type
Purchase Details
Closed on
Dec 30, 2024
Sold by
Patrick J Dempsey Family Trust and Dempsey John P
Bought by
Casey & Ann Olsen Family Trust and Olson
Current Estimated Value
Create a Home Valuation Report for This Property
The Home Valuation Report is an in-depth analysis detailing your home's value as well as a comparison with similar homes in the area
Home Values in the Area
Average Home Value in this Area
Purchase History
| Date | Buyer | Sale Price | Title Company |
|---|---|---|---|
| Casey & Ann Olsen Family Trust | -- | None Listed On Document | |
| Casey & Ann Olsen Family Trust | -- | None Listed On Document |
Source: Public Records
Tax History Compared to Growth
Tax History
| Year | Tax Paid | Tax Assessment Tax Assessment Total Assessment is a certain percentage of the fair market value that is determined by local assessors to be the total taxable value of land and additions on the property. | Land | Improvement |
|---|---|---|---|---|
| 2025 | $10,145 | $936,360 | $598,230 | $338,130 |
| 2024 | $625 | $918,000 | $586,500 | $331,500 |
| 2023 | $625 | $56,459 | $12,306 | $44,153 |
| 2022 | $586 | $55,353 | $12,065 | $43,288 |
| 2021 | $576 | $54,269 | $11,829 | $42,440 |
| 2020 | $571 | $53,713 | $11,708 | $42,005 |
| 2019 | $565 | $52,661 | $11,479 | $41,182 |
| 2018 | $554 | $51,629 | $11,254 | $40,375 |
| 2017 | $543 | $50,618 | $11,034 | $39,584 |
| 2016 | $532 | $49,626 | $10,818 | $38,808 |
| 2015 | $524 | $48,882 | $10,656 | $38,226 |
| 2014 | $481 | $47,926 | $10,448 | $37,478 |
Source: Public Records
Map
Nearby Homes
- 717 Islay St
- 1407 Beach St
- 880 Buchon St
- 581 Higuera St Unit 302
- 581 Higuera St Unit 207
- 581 Higuera St Unit 208
- 581 Higuera St Unit 301
- 581 Higuera St Unit 210
- 581 Higuera St Unit 307
- 581 Higuera St Unit 201
- 581 Higuera St Unit 203
- 581 Higuera St Unit 308
- 581 Higuera St Unit 306
- 1700 Osos St
- 1010 Church St
- 1328 Morro St Unit 130
- 274 Higuera St Unit 8
- 274 Higuera St Unit 9
- 274 Higuera St Unit 17
- 145 South St Unit a44