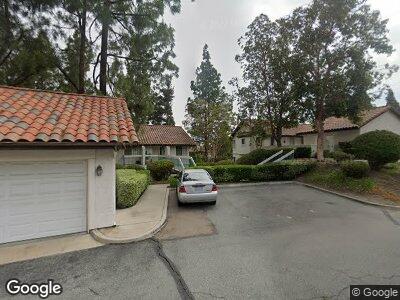
16452 Avenida Venusto Unit D San Diego, CA 92128
Rancho Bernardo NeighborhoodEstimated Value: $714,045 - $750,000
2
Beds
2
Baths
1,230
Sq Ft
$593/Sq Ft
Est. Value
About This Home
This home is located at 16452 Avenida Venusto Unit D, San Diego, CA 92128 and is currently estimated at $729,261, approximately $592 per square foot. 16452 Avenida Venusto Unit D is a home located in San Diego County with nearby schools including Highland Ranch Elementary School, Bernardo Heights Middle, and Rancho Bernardo High.
Ownership History
Date
Name
Owned For
Owner Type
Purchase Details
Closed on
Sep 13, 2002
Sold by
Tung Allen W and Recinos Tung Monica
Bought by
Recinos Joe R and Recinos Mary J
Current Estimated Value
Purchase Details
Closed on
Sep 10, 2002
Sold by
Recinos Mario O and Shiraki Dina R
Bought by
Recinos Joe R and Recinos Mary J
Purchase Details
Closed on
Aug 21, 2000
Sold by
Rings Charles A
Bought by
Tung Allen W and Recinos Tung Monica
Home Financials for this Owner
Home Financials are based on the most recent Mortgage that was taken out on this home.
Original Mortgage
$162,000
Interest Rate
7.96%
Mortgage Type
Purchase Money Mortgage
Purchase Details
Closed on
Oct 25, 1990
Create a Home Valuation Report for This Property
The Home Valuation Report is an in-depth analysis detailing your home's value as well as a comparison with similar homes in the area
Home Values in the Area
Average Home Value in this Area
Purchase History
| Date | Buyer | Sale Price | Title Company |
|---|---|---|---|
| Recinos Joe R | -- | -- | |
| Recinos Joe R | -- | -- | |
| Tung Allen W | $202,500 | New Century Title Company | |
| Rings Charles Alan | -- | New Century Title Company | |
| -- | $145,000 | -- |
Source: Public Records
Mortgage History
| Date | Status | Borrower | Loan Amount |
|---|---|---|---|
| Open | Recinos Joe R | $544,185 | |
| Closed | Recinos Joe R | $544,185 | |
| Closed | Recinos Joe R | $50,000 | |
| Closed | Recinos Joe R | $168,000 | |
| Previous Owner | Tung Allen W | $162,000 | |
| Previous Owner | Rings Charles Alan | $17,800 | |
| Previous Owner | Rings Charles Alan | $121,600 |
Source: Public Records
Tax History Compared to Growth
Tax History
| Year | Tax Paid | Tax Assessment Tax Assessment Total Assessment is a certain percentage of the fair market value that is determined by local assessors to be the total taxable value of land and additions on the property. | Land | Improvement |
|---|---|---|---|---|
| 2024 | $3,320 | $299,127 | $128,198 | $170,929 |
| 2023 | $3,248 | $293,263 | $125,685 | $167,578 |
| 2022 | $3,192 | $287,514 | $123,221 | $164,293 |
| 2021 | $3,149 | $281,877 | $120,805 | $161,072 |
| 2020 | $3,106 | $278,988 | $119,567 | $159,421 |
| 2019 | $3,024 | $273,519 | $117,223 | $156,296 |
| 2018 | $2,938 | $268,157 | $114,925 | $153,232 |
| 2017 | $2,858 | $262,900 | $112,672 | $150,228 |
| 2016 | $2,798 | $257,746 | $110,463 | $147,283 |
| 2015 | $2,755 | $253,875 | $108,804 | $145,071 |
| 2014 | $2,689 | $248,903 | $106,673 | $142,230 |
Source: Public Records
Map
Nearby Homes
- 16304 Avenida Venusto Unit E
- 16170 Avenida Venusto Unit 50
- 16470 Avenida Venusto Unit B
- 16404 Avenida Venusto Unit E
- 16096 Caminito Tomas
- 16504 Calle Pulido
- 16528 Calle Pulido
- 16010 Caminito Tomas
- 11824 Paseo Lucido Unit 32
- 12131 View Pointe Row
- 12091 Lomica Dr
- 12093 Callado Rd
- 11941 Callado Rd
- 15852 Caminito Cercado
- 15804 Caminito Cercado
- 16071 Sun Summit Point
- 12195 San Tomas Place
- 16736 Diego Dr
- 12240 Horado Rd
- 12132 Royal Birkdale Row Unit 302E
- 16452 Avenida Venusto Unit E
- 16452 Avenida Venusto Unit C
- 16452 Avenida Venusto Unit A
- 16452 Avenida Venusto Unit B
- 16446 Avenida Venusto Unit A
- 16446 Avenida Venusto Unit B
- 16446 Avenida Venusto Unit C
- 16452 Avenida Venusto Unit D
- 16274 Avenida Venusto Unit B
- 16274 Avenida Venusto
- 16226 Avenida Venusto
- 16244 Avenida Venusto Unit A
- 16244 Avenida Venusto
- 16226 Avenida Venusto
- 16280 Avenida Venusto
- 16268 Avenida Venusto
- 16266 Avenida Venusto Unit D
- 16266 Avenida Venusto Unit A
- 16250 Avenida Venusto Unit B