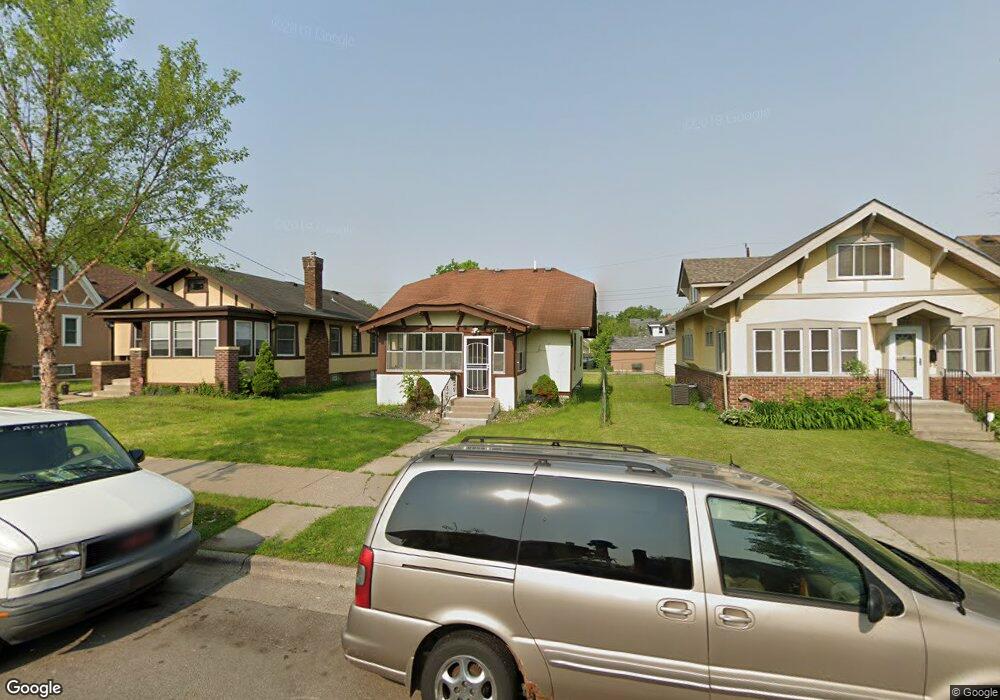
1647 Sheridan Ave N Minneapolis, MN 55411
Willard-Hay NeighborhoodEstimated Value: $158,000 - $202,000
2
Beds
1
Bath
816
Sq Ft
$224/Sq Ft
Est. Value
About This Home
This home is located at 1647 Sheridan Ave N, Minneapolis, MN 55411 and is currently estimated at $182,819, approximately $224 per square foot. 1647 Sheridan Ave N is a home located in Hennepin County with nearby schools including Bryn Mawr Elementary School, Anwatin Middle School, and North High School.
Ownership History
Date
Name
Owned For
Owner Type
Purchase Details
Closed on
Feb 4, 2012
Sold by
Schnabel Del and Schnabel Clarinda
Bought by
Minnestpopolis Vii Llc
Current Estimated Value
Purchase Details
Closed on
Feb 3, 2012
Sold by
Gollywog Properties Llc
Bought by
Schnabel Del
Purchase Details
Closed on
Jul 28, 2009
Sold by
M & I Marshall & Isley Bank
Bought by
Gollywog Properties Llc
Purchase Details
Closed on
Jun 29, 2007
Sold by
Quintanilla Ana M and Auger Brian J
Bought by
Mancilla Arnulfo
Purchase Details
Closed on
Aug 10, 2001
Sold by
Pang Gina
Bought by
Quintanilla Ana
Purchase Details
Closed on
Apr 20, 1995
Sold by
First Nationwide
Bought by
Pang Gina G
Create a Home Valuation Report for This Property
The Home Valuation Report is an in-depth analysis detailing your home's value as well as a comparison with similar homes in the area
Home Values in the Area
Average Home Value in this Area
Purchase History
| Date | Buyer | Sale Price | Title Company |
|---|---|---|---|
| Minnestpopolis Vii Llc | -- | Dca Title | |
| Schnabel Del | -- | Cities Title Services | |
| Schndabel Del | $312,000 | Cities Title Services | |
| Gollywog Properties Llc | $22,000 | -- | |
| Mancilla Arnulfo | $135,000 | -- | |
| Quintanilla Ana | $92,000 | -- | |
| Pang Gina G | $20,000 | -- |
Source: Public Records
Tax History Compared to Growth
Tax History
| Year | Tax Paid | Tax Assessment Tax Assessment Total Assessment is a certain percentage of the fair market value that is determined by local assessors to be the total taxable value of land and additions on the property. | Land | Improvement |
|---|---|---|---|---|
| 2024 | $2,072 | $140,000 | $16,000 | $124,000 |
| 2023 | $1,898 | $146,000 | $16,000 | $130,000 |
| 2022 | $1,739 | $146,000 | $16,000 | $130,000 |
| 2021 | $1,399 | $126,000 | $10,000 | $116,000 |
| 2020 | $1,378 | $105,000 | $14,300 | $90,700 |
| 2019 | $1,505 | $95,500 | $9,500 | $86,000 |
| 2018 | $1,464 | $87,000 | $9,500 | $77,500 |
| 2017 | $1,499 | $83,500 | $8,600 | $74,900 |
| 2016 | $1,544 | $83,500 | $8,600 | $74,900 |
| 2015 | $1,553 | $80,000 | $8,600 | $71,400 |
| 2014 | -- | $70,500 | $8,600 | $61,900 |
Source: Public Records
Map
Nearby Homes
- 1642 Thomas Ave N
- 2604 Golden Valley Rd
- 1722 Queen Ave N
- 2007 Queen Ave N
- 1800 Penn Ave N
- 2817 Golden Valley Rd
- 1423 Upton Ave N
- 2114 Sheridan Ave N
- 1411 Upton Ave N
- 1423 Penn Ave N
- 1519 Oliver Ave N
- 1400 Queen Ave N
- 1819 Newton Ave N
- 1336 Russell Ave N
- 1332 Upton Ave N
- 1942 Oliver Ave N
- 2119 Oliver Ave N
- 2304 N Sheridan Ave
- 2600 Plymouth Ave N Unit A
- 1623 Morgan Ave N
- 1651 Sheridan Ave N
- 1643 Sheridan Ave N
- 1655 Sheridan Ave N
- 1639 Sheridan Ave N
- 1635 Sheridan Ave N
- 1659 Sheridan Ave N
- 1646 Thomas Ave N
- 1650 Thomas Ave N
- 1631 Sheridan Ave N
- 1638 Thomas Ave N
- 1654 Thomas Ave N
- 1634 Thomas Ave N
- 1658 Thomas Ave N
- 1646 Sheridan Ave N
- 1642 Sheridan Ave N
- 1650 Sheridan Ave N
- 1627 Sheridan Ave N
- 1636 Sheridan Ave N
- 1654 Sheridan Ave N
- 1630 Thomas Ave N