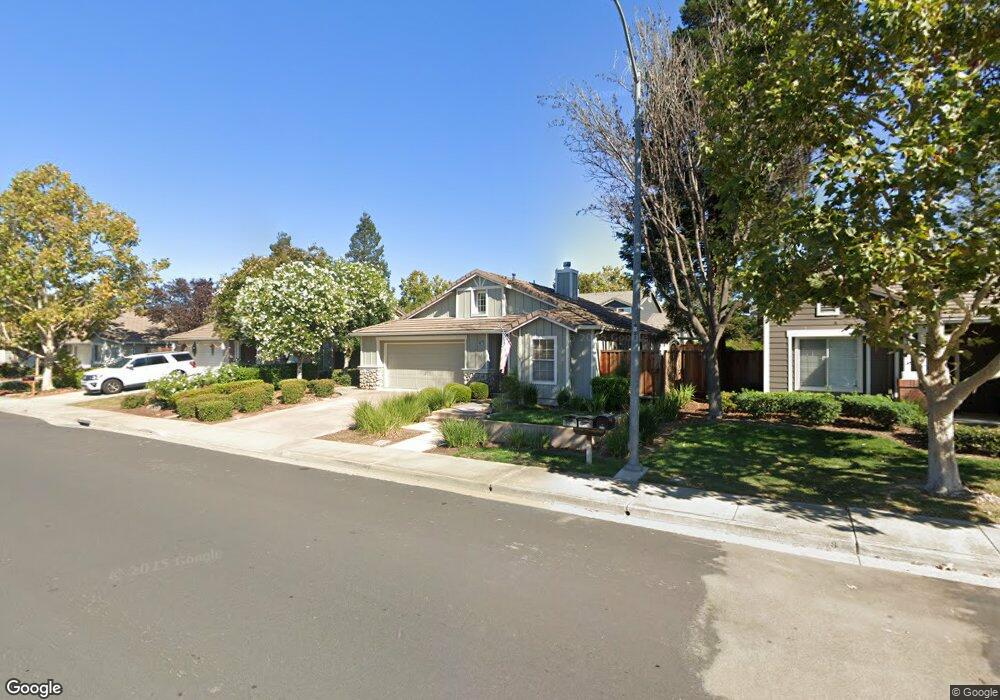
1647 Sutter St Livermore, CA 94551
Summerset NeighborhoodEstimated Value: $987,640 - $1,114,000
3
Beds
2
Baths
1,254
Sq Ft
$842/Sq Ft
Est. Value
About This Home
This home is located at 1647 Sutter St, Livermore, CA 94551 and is currently estimated at $1,056,160, approximately $842 per square foot. 1647 Sutter St is a home located in Alameda County with nearby schools including Rancho Las Positas Elementary School, Junction Avenue K-8 School, and Granada High School.
Ownership History
Date
Name
Owned For
Owner Type
Purchase Details
Closed on
Apr 19, 2007
Sold by
Lohrengel Frances J and Lohrengel Frances J
Bought by
Lohrengel Frances J and The Frances J Lohrengel Revoca
Current Estimated Value
Purchase Details
Closed on
Dec 9, 1998
Sold by
Kbone Inc
Bought by
Reiches Brad and Reiches Karen
Home Financials for this Owner
Home Financials are based on the most recent Mortgage that was taken out on this home.
Original Mortgage
$207,910
Outstanding Balance
$47,757
Interest Rate
6.91%
Mortgage Type
Stand Alone First
Estimated Equity
$1,008,403
Purchase Details
Closed on
May 2, 1997
Sold by
Hearthstone Alameda Lot Option Lp
Bought by
Kaufman & Broad Of Northern California
Create a Home Valuation Report for This Property
The Home Valuation Report is an in-depth analysis detailing your home's value as well as a comparison with similar homes in the area
Home Values in the Area
Average Home Value in this Area
Purchase History
| Date | Buyer | Sale Price | Title Company |
|---|---|---|---|
| Lohrengel Frances J | -- | None Available | |
| Reiches Brad | $260,000 | First American Title Guarant | |
| Kaufman & Broad Of Northern California | -- | First American Title Guarant |
Source: Public Records
Mortgage History
| Date | Status | Borrower | Loan Amount |
|---|---|---|---|
| Open | Reiches Brad | $207,910 | |
| Closed | Reiches Brad | $26,000 |
Source: Public Records
Tax History
| Year | Tax Paid | Tax Assessment Tax Assessment Total Assessment is a certain percentage of the fair market value that is determined by local assessors to be the total taxable value of land and additions on the property. | Land | Improvement |
|---|---|---|---|---|
| 2025 | $2,232 | $95,822 | $30,241 | $72,581 |
| 2024 | $2,232 | $93,806 | $29,648 | $71,158 |
| 2023 | $2,170 | $98,830 | $29,067 | $69,763 |
| 2022 | $2,106 | $89,892 | $28,497 | $68,395 |
| 2021 | $1,298 | $87,992 | $27,938 | $67,054 |
| 2020 | $1,958 | $94,019 | $27,652 | $66,367 |
| 2019 | $1,941 | $92,176 | $27,110 | $65,066 |
| 2018 | $1,870 | $90,368 | $26,578 | $63,790 |
| 2017 | $1,799 | $88,597 | $26,057 | $62,540 |
| 2016 | $1,698 | $86,861 | $25,547 | $61,314 |
| 2015 | $1,589 | $85,556 | $25,163 | $60,393 |
| 2014 | $1,505 | $83,880 | $24,670 | $59,210 |
Source: Public Records
Map
Nearby Homes
- 1382 Vía Deste Unit 61
- 1279 Via Jose Unit 106
- 849 Tranquility Cir Unit 3
- 865 Tranquility Cir Unit 3
- 897 Tranquility Cir Unit 12
- 772 Tranquility Cir Unit 2
- 716 Tranquility Cir Unit 1
- 253 Fennel Way
- 1059 Lakehurst Rd
- Plan 1 at Parkview
- Plan 2 at Parkview
- 1320 Portola Ave
- 1322 Portola Ave
- 1324 Portola Ave
- 1330 Portola Ave
- 707 Sandpiper Common
- 761 Pine St
- 1785 Paseo Laguna Seco
- 1169 Apache St
- 174 Tamalpais Ave
- 1669 Sutter St
- 1635 Sutter St
- 1681 Sutter St
- 1611 Sutter St
- 806 Saddleback Cir
- 828 Saddleback Cir
- 832 Saddleback Cir
- 1693 Sutter St
- 794 Saddleback Cir
- 502 Stetson Way
- 514 Stetson Way
- 846 Saddleback Cir
- 536 Stetson Way
- 1715 Sutter St
- 788 Saddleback Cir
- 548 Stetson Way
- 854 Saddleback Cir
- 817 Saddleback Cir
- 831 Saddleback Cir
- 550 Stetson Way
Your Personal Tour Guide
Ask me questions while you tour the home.