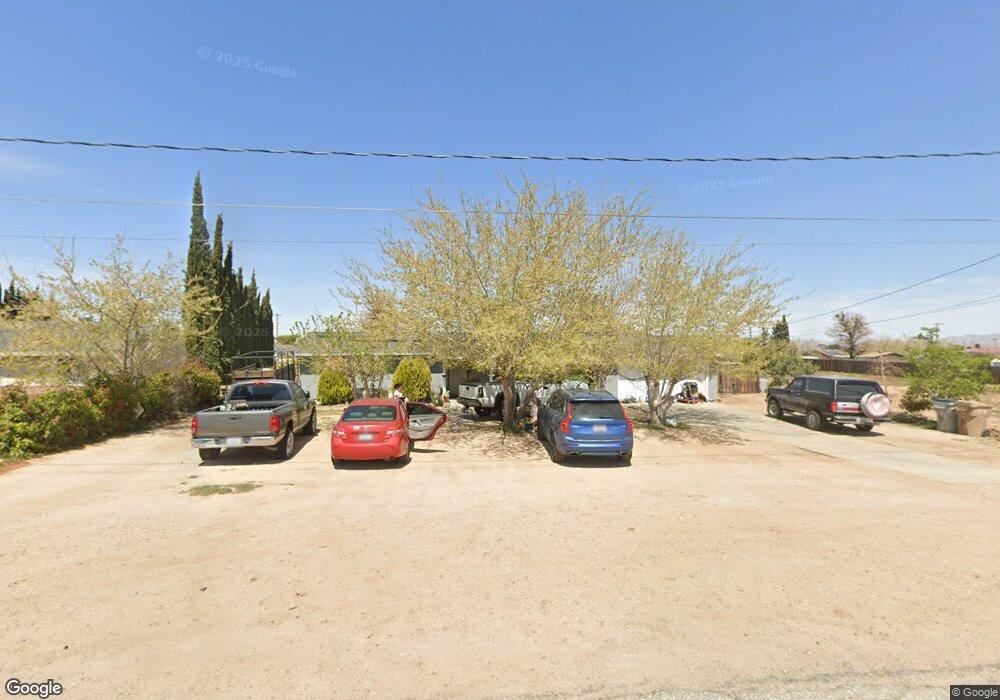
16470 Sage St Hesperia, CA 92345
The Mesa NeighborhoodEstimated Value: $404,274 - $451,000
3
Beds
2
Baths
1,400
Sq Ft
$304/Sq Ft
Est. Value
About This Home
This home is located at 16470 Sage St, Hesperia, CA 92345 and is currently estimated at $425,569, approximately $303 per square foot. 16470 Sage St is a home located in San Bernardino County with nearby schools including Lime Street Elementary School, Ranchero Middle School, and Sultana High School.
Ownership History
Date
Name
Owned For
Owner Type
Purchase Details
Closed on
Nov 12, 2021
Sold by
Palomino Sonia
Bought by
Palomino Sonia
Current Estimated Value
Home Financials for this Owner
Home Financials are based on the most recent Mortgage that was taken out on this home.
Original Mortgage
$251,000
Outstanding Balance
$230,316
Interest Rate
3.09%
Mortgage Type
New Conventional
Estimated Equity
$195,253
Purchase Details
Closed on
May 1, 2018
Sold by
Palomino Imelda
Bought by
Palomino Sonia
Purchase Details
Closed on
Apr 3, 1998
Sold by
Home Svgs Of America Fsb
Bought by
Palomino Gilberto and Palomino Imelda
Home Financials for this Owner
Home Financials are based on the most recent Mortgage that was taken out on this home.
Original Mortgage
$59,350
Interest Rate
7.1%
Mortgage Type
FHA
Purchase Details
Closed on
Mar 6, 1997
Sold by
Bates Lowell M and Bates Patricia A
Bought by
Coast Federal Bank Fsb
Create a Home Valuation Report for This Property
The Home Valuation Report is an in-depth analysis detailing your home's value as well as a comparison with similar homes in the area
Home Values in the Area
Average Home Value in this Area
Purchase History
| Date | Buyer | Sale Price | Title Company |
|---|---|---|---|
| Palomino Sonia | -- | Fidelity National Title Co | |
| Palomino Sonia | -- | None Available | |
| Palomino Gilberto | $59,000 | Investors Title Company | |
| Coast Federal Bank Fsb | $50,000 | American Title Co |
Source: Public Records
Mortgage History
| Date | Status | Borrower | Loan Amount |
|---|---|---|---|
| Open | Palomino Sonia | $251,000 | |
| Previous Owner | Palomino Gilberto | $59,350 |
Source: Public Records
Tax History Compared to Growth
Tax History
| Year | Tax Paid | Tax Assessment Tax Assessment Total Assessment is a certain percentage of the fair market value that is determined by local assessors to be the total taxable value of land and additions on the property. | Land | Improvement |
|---|---|---|---|---|
| 2025 | $1,245 | $117,583 | $15,679 | $101,904 |
| 2024 | $1,245 | $115,278 | $15,372 | $99,906 |
| 2023 | $1,230 | $113,018 | $15,071 | $97,947 |
| 2022 | $1,201 | $110,801 | $14,775 | $96,026 |
| 2021 | $4,698 | $108,628 | $14,485 | $94,143 |
| 2020 | $4,674 | $107,514 | $14,336 | $93,178 |
| 2019 | $1,140 | $105,406 | $14,055 | $91,351 |
| 2018 | $1,117 | $103,339 | $13,779 | $89,560 |
| 2017 | $1,097 | $101,313 | $13,509 | $87,804 |
| 2016 | $1,073 | $99,326 | $13,244 | $86,082 |
| 2015 | $1,059 | $97,834 | $13,045 | $84,789 |
| 2014 | $1,044 | $95,917 | $12,789 | $83,128 |
Source: Public Records
Map
Nearby Homes