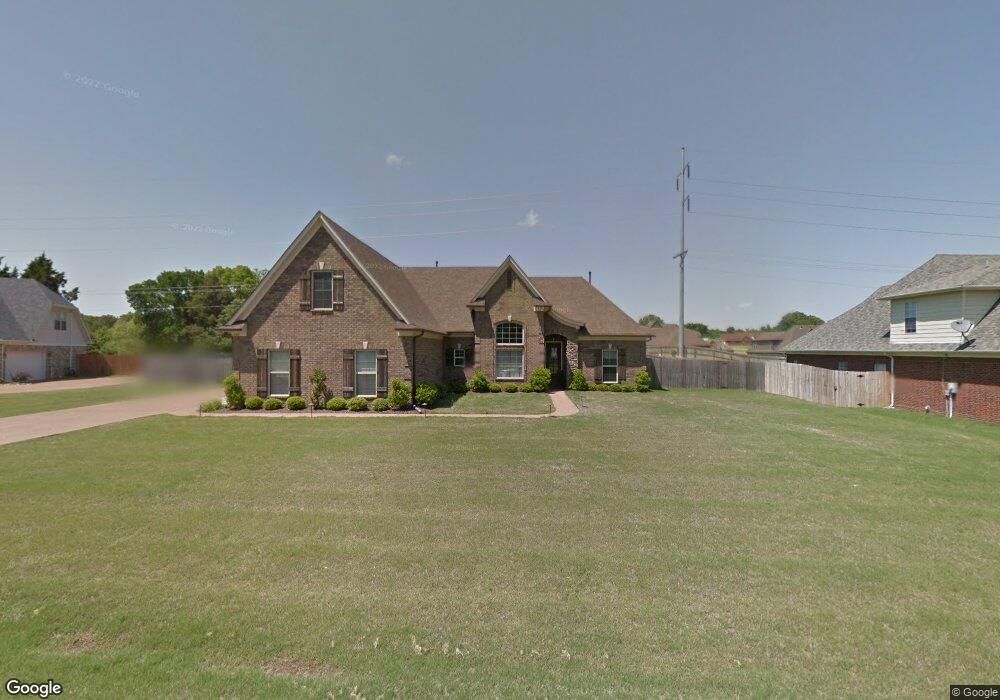
1648 Imboden Cove Nesbit, MS 38651
Pleasant Hill NeighborhoodEstimated Value: $420,000 - $503,000
3
Beds
--
Bath
3,236
Sq Ft
$139/Sq Ft
Est. Value
About This Home
This home is located at 1648 Imboden Cove, Nesbit, MS 38651 and is currently estimated at $449,870, approximately $139 per square foot. 1648 Imboden Cove is a home with nearby schools including DeSoto Central Primary School, DeSoto Central Elementary School, and DeSoto Central Middle School.
Ownership History
Date
Name
Owned For
Owner Type
Purchase Details
Closed on
Sep 2, 2014
Sold by
Wright Jack and Wright Abby
Bought by
Perkins Billy P and Perkins Diana S
Current Estimated Value
Home Financials for this Owner
Home Financials are based on the most recent Mortgage that was taken out on this home.
Original Mortgage
$200,000
Outstanding Balance
$153,452
Interest Rate
4.2%
Mortgage Type
New Conventional
Estimated Equity
$296,418
Create a Home Valuation Report for This Property
The Home Valuation Report is an in-depth analysis detailing your home's value as well as a comparison with similar homes in the area
Home Values in the Area
Average Home Value in this Area
Purchase History
| Date | Buyer | Sale Price | Title Company |
|---|---|---|---|
| Perkins Billy P | -- | None Available |
Source: Public Records
Mortgage History
| Date | Status | Borrower | Loan Amount |
|---|---|---|---|
| Open | Perkins Billy P | $200,000 |
Source: Public Records
Tax History Compared to Growth
Tax History
| Year | Tax Paid | Tax Assessment Tax Assessment Total Assessment is a certain percentage of the fair market value that is determined by local assessors to be the total taxable value of land and additions on the property. | Land | Improvement |
|---|---|---|---|---|
| 2024 | $2,255 | $23,079 | $3,200 | $19,879 |
| 2023 | $2,255 | $23,079 | $0 | $0 |
| 2022 | $2,971 | $23,079 | $3,200 | $19,879 |
| 2021 | $2,971 | $23,079 | $3,200 | $19,879 |
| 2020 | $2,745 | $21,489 | $3,200 | $18,289 |
| 2019 | $2,745 | $21,489 | $3,200 | $18,289 |
| 2017 | $2,597 | $37,476 | $20,338 | $17,138 |
| 2016 | $2,597 | $20,338 | $3,200 | $17,138 |
| 2015 | $2,897 | $37,476 | $20,338 | $17,138 |
| 2014 | $2,597 | $20,338 | $0 | $0 |
| 2013 | $684 | $20,338 | $0 | $0 |
Source: Public Records
Map
Nearby Homes
- 2898 Blackrock Dr
- 1668 Farindale Cove
- 2806 Black Rock Rd
- 3121 Marcia Louise Dr
- 2154 Laughter Rd N
- 3520 Lindsey Ln
- 966 Buttermilk Dr
- 3571 W Enclave Dr
- 939 Buttermilk Dr
- 1663 Ryker Rd
- 1655 Ryker Rd
- 1644 Ryker Rd
- Plan 1700 at Cherry Tree Park South
- The 1635-C Plan at Cherry Tree Park South
- Plan 2020 at Cherry Tree Park South
- Plan 1717 at Cherry Tree Park South
- Plan 2300 at Cherry Tree Park South
- Plan 2200 at Cherry Tree Park South
- Plan 1930 at Cherry Tree Park South
- Plan 2030 at Cherry Tree Park South
- 1648 Imboden Cove
- 1670 Imboden Cove
- 1623 Imboden Cove
- 1632 Imboden Cove
- 1688 Imboden Cove
- 1647 Imboden Cove
- 1633 Farindale Cove
- 1624 Imboden Cove
- 1649 Farindale Cove
- 1669 Imboden Cove
- 1667 Farindale Cove
- 1623 Imboden Cove
- 1631 Imboden Cove
- 1687 Imboden Cove
- 11 Black Rock Rd
- 10 Black Rock Rd
- 1689 Farindale Cove
- 2924 Black Rock Rd
- 2924 Rock Rd
- 1625 Farindale Cove