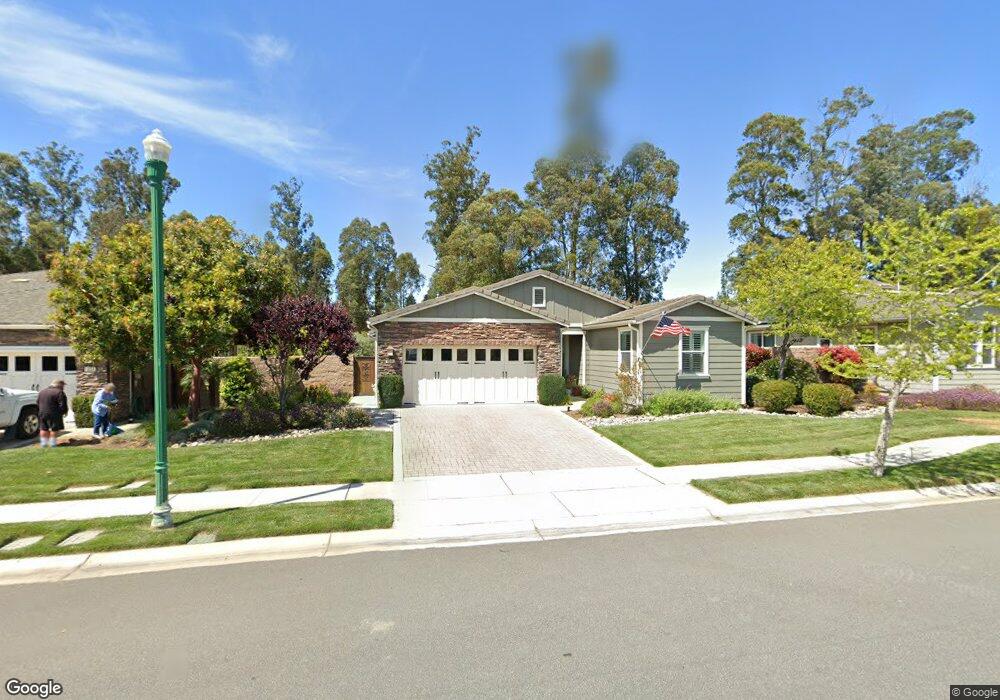
1648 Northwood Rd Nipomo, CA 93444
Woodlands NeighborhoodEstimated Value: $974,000 - $1,095,000
2
Beds
2
Baths
1,669
Sq Ft
$617/Sq Ft
Est. Value
About This Home
This home is located at 1648 Northwood Rd, Nipomo, CA 93444 and is currently estimated at $1,030,490, approximately $617 per square foot. 1648 Northwood Rd is a home located in San Luis Obispo County with nearby schools including Dorothea Lange Elementary School, Mesa Middle School, and Nipomo High School.
Ownership History
Date
Name
Owned For
Owner Type
Purchase Details
Closed on
Aug 26, 2016
Sold by
Harrison Alexander Thurston and Harrison Megan Lyndsay
Bought by
Harrison Alexander Thurston and Harrison Megan Lyndsay
Current Estimated Value
Home Financials for this Owner
Home Financials are based on the most recent Mortgage that was taken out on this home.
Original Mortgage
$285,000
Outstanding Balance
$131,881
Interest Rate
3.45%
Mortgage Type
New Conventional
Estimated Equity
$898,609
Purchase Details
Closed on
Aug 31, 2010
Sold by
Doud Tracy R
Bought by
Harrison Alexander T and Harrison Megan Lindsay
Home Financials for this Owner
Home Financials are based on the most recent Mortgage that was taken out on this home.
Original Mortgage
$318,750
Interest Rate
4.38%
Mortgage Type
New Conventional
Create a Home Valuation Report for This Property
The Home Valuation Report is an in-depth analysis detailing your home's value as well as a comparison with similar homes in the area
Home Values in the Area
Average Home Value in this Area
Purchase History
| Date | Buyer | Sale Price | Title Company |
|---|---|---|---|
| Harrison Alexander Thurston | -- | Fidelity National Title Co | |
| Harrison Alexander T | $425,000 | Fidelity National Title Co | |
| Doud Tracy R | -- | Fidelity National Title Co |
Source: Public Records
Mortgage History
| Date | Status | Borrower | Loan Amount |
|---|---|---|---|
| Open | Harrison Alexander Thurston | $285,000 | |
| Closed | Harrison Alexander T | $318,750 |
Source: Public Records
Tax History Compared to Growth
Tax History
| Year | Tax Paid | Tax Assessment Tax Assessment Total Assessment is a certain percentage of the fair market value that is determined by local assessors to be the total taxable value of land and additions on the property. | Land | Improvement |
|---|---|---|---|---|
| 2025 | $5,600 | $544,487 | $320,289 | $224,198 |
| 2024 | $5,536 | $533,811 | $314,009 | $219,802 |
| 2023 | $5,536 | $523,345 | $307,852 | $215,493 |
| 2022 | $5,453 | $513,084 | $301,816 | $211,268 |
| 2021 | $5,443 | $503,025 | $295,899 | $207,126 |
| 2020 | $5,381 | $497,868 | $292,865 | $205,003 |
| 2019 | $5,348 | $488,107 | $287,123 | $200,984 |
| 2018 | $5,284 | $478,538 | $281,494 | $197,044 |
| 2017 | $5,185 | $469,156 | $275,975 | $193,181 |
| 2016 | $4,890 | $459,958 | $270,564 | $189,394 |
| 2015 | $4,820 | $453,050 | $266,500 | $186,550 |
| 2014 | $4,641 | $444,176 | $261,280 | $182,896 |
Source: Public Records
Map
Nearby Homes
- 961 Jacqueline Place
- 977 Jacqueline Place
- 1539 Vista Tesoro Place
- 1783 Trilogy Pkwy
- 1685 Louise Ln
- 808 Albert Way
- 708 Albert Way
- 1147 Vaquero Way
- 1441 Vicki Ln
- 1024 Maggie Ln
- 1153 Spring Azure Way
- 1084 Emma Ln
- 1156 Spring Azure Way
- 1354 Trail View Place
- 1849 Eucalyptus Rd
- 1160 Korey Ct
- 1187 Swallowtail Way
- 1175 Danielle Ct
- 1060 Dawn Rd
- 1455 Via Vista
- 1642 Northwood Rd
- 1654 Northwood Rd
- 1636 Northwood Rd Unit 2
- 1660 Northwood Rd
- 915 Bea Ct
- 916 Bea Ct
- 1630 Northwood Rd
- 917 Bea Ct
- 918 Bea Ct
- 1672 Northwood Rd
- 915 Lilly Ct
- 919 Bea Ct
- 917 Lilly Ct
- 920 Bea Ct
- 1477 Dawn Rd
- 1618 Northwood Rd
- 1678 Northwood Rd
- 921 Bea Ct
- 1612 Northwood Rd
- 1684 Northwood Rd