Estimated Value: $565,000 - $739,000
3
Beds
2
Baths
2,754
Sq Ft
$226/Sq Ft
Est. Value
About This Home
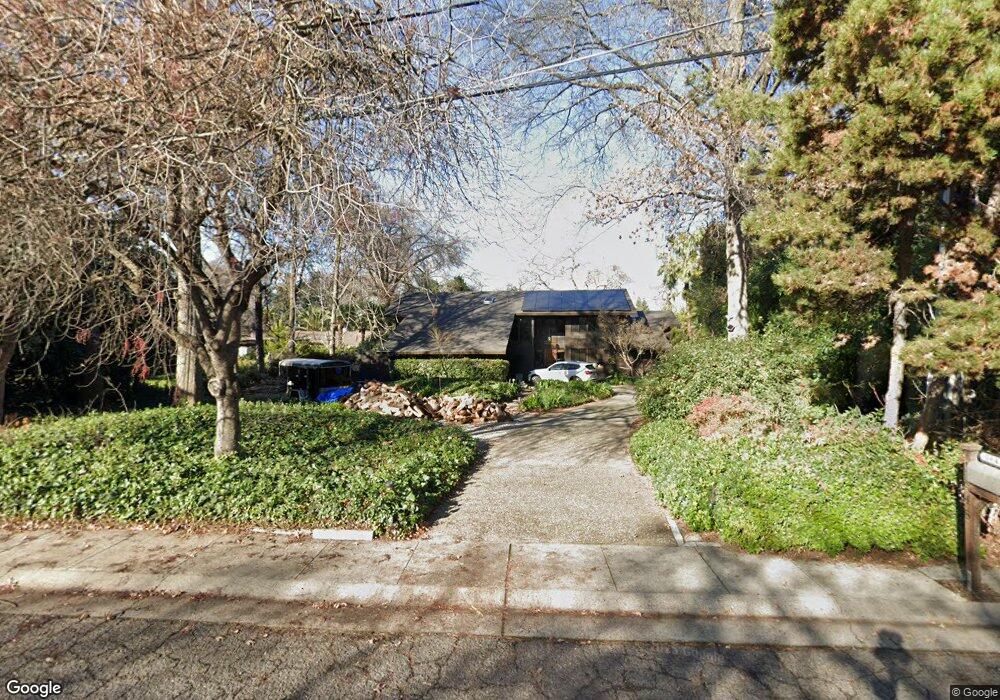
This home is located at 1648 Oak Park Ave, Chico, CA 95928 and is currently estimated at $621,292, approximately $225 per square foot. 1648 Oak Park Ave is a home located in Butte County with nearby schools including Emma Wilson Elementary School, Chico Junior High School, and Chico High School.
Ownership History
Date
Name
Owned For
Owner Type
Purchase Details
Closed on
Oct 18, 2022
Sold by
Jon And Lynne Gingrich Family Trust
Bought by
Lynne M Gingrich Irrevocable Trust
Current Estimated Value
Purchase Details
Closed on
Nov 13, 2014
Sold by
Gingrich Lynn M
Bought by
The Jon & Lynne Gingrich Family Trust
Purchase Details
Closed on
Jul 16, 2012
Sold by
Gingrich Lynne M
Bought by
Gingrich Lynne M
Purchase Details
Closed on
Jan 24, 2008
Sold by
Gingrich Lynne M
Bought by
Gingrich Lynne M and The Craig A Havel Trust
Purchase Details
Closed on
Aug 13, 2007
Sold by
Mclain Janiece B
Bought by
Mclain Janiece B and Gingrich Lynne M
Purchase Details
Closed on
Dec 17, 2001
Sold by
Joaquin Janiece B
Bought by
Mclain Janiece B and The Janiece Mclain Family Trust
Purchase Details
Closed on
Nov 9, 1999
Sold by
Joaquin Janiece B
Bought by
Mclain Janiece B
Create a Home Valuation Report for This Property
The Home Valuation Report is an in-depth analysis detailing your home's value as well as a comparison with similar homes in the area
Purchase History
| Date | Buyer | Sale Price | Title Company |
|---|---|---|---|
| Lynne M Gingrich Irrevocable Trust | -- | -- | |
| The Jon & Lynne Gingrich Family Trust | -- | None Available | |
| Gingrich Lynne M | -- | None Available | |
| Gingrich Lynne M | -- | None Available | |
| Mclain Janiece B | -- | None Available | |
| Mclain Janiece B | -- | -- | |
| Mclain Janiece B | -- | -- |
Source: Public Records
Tax History
| Year | Tax Paid | Tax Assessment Tax Assessment Total Assessment is a certain percentage of the fair market value that is determined by local assessors to be the total taxable value of land and additions on the property. | Land | Improvement |
|---|---|---|---|---|
| 2025 | $3,468 | $326,478 | $53,116 | $273,362 |
| 2024 | $3,468 | $320,077 | $52,075 | $268,002 |
| 2023 | $3,425 | $313,802 | $51,054 | $262,748 |
| 2022 | $3,367 | $307,650 | $50,053 | $257,597 |
| 2021 | $3,302 | $301,619 | $49,072 | $252,547 |
| 2020 | $3,292 | $298,527 | $48,569 | $249,958 |
| 2019 | $3,231 | $292,674 | $47,617 | $245,057 |
| 2018 | $2,894 | $262,427 | $46,684 | $215,743 |
| 2017 | $2,833 | $257,282 | $45,769 | $211,513 |
| 2016 | $2,585 | $252,238 | $44,872 | $207,366 |
| 2015 | $2,584 | $248,450 | $44,198 | $204,252 |
| 2014 | $2,520 | $243,584 | $43,333 | $200,251 |
Source: Public Records
Map
Nearby Homes
- 1680 Oak Park Ave
- 1628 Oak Park Ave
- 1620 Oak Park Ave
- 1641 Oak Park Ave
- 1236 Bidwell Ave
- 1230 Bidwell Ave
- 1704 Oak Park Ave
- 1224 Bidwell Ave
- 1246 Bidwell Ave
- 1220 Bidwell Ave
- 1603 Oak Park Ave
- 1306 Bidwell Ave
- 1616 Oak Park Ave
- 1310 Bidwell Ave
- 2 Via Los Arboles
- 1208 Bidwell Ave
- 1 Via Los Arboles
- 1202 Bidwell Ave
- 1610 Oak Park Ave
- 1326 Bidwell Ave
Your Personal Tour Guide
Ask me questions while you tour the home.