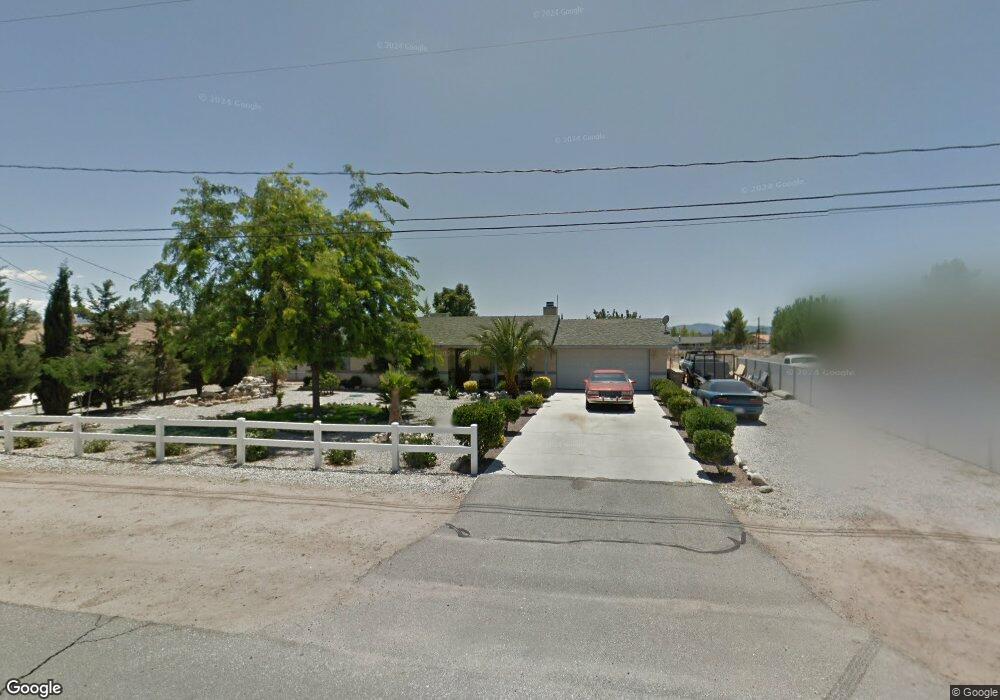
16495 Joshua St Hesperia, CA 92345
The Mesa NeighborhoodEstimated Value: $392,968 - $434,000
3
Beds
2
Baths
1,216
Sq Ft
$343/Sq Ft
Est. Value
About This Home
This home is located at 16495 Joshua St, Hesperia, CA 92345 and is currently estimated at $416,742, approximately $342 per square foot. 16495 Joshua St is a home located in San Bernardino County with nearby schools including Lime Street Elementary School, Ranchero Middle School, and Sultana High School.
Ownership History
Date
Name
Owned For
Owner Type
Purchase Details
Closed on
Oct 5, 1999
Sold by
Hud
Bought by
Rimmer Sean
Current Estimated Value
Home Financials for this Owner
Home Financials are based on the most recent Mortgage that was taken out on this home.
Original Mortgage
$64,468
Outstanding Balance
$19,451
Interest Rate
7.82%
Mortgage Type
FHA
Estimated Equity
$397,291
Purchase Details
Closed on
Jun 8, 1999
Sold by
Union Planters Bank Na
Bought by
Hud
Purchase Details
Closed on
Jun 3, 1999
Sold by
Lander James R
Bought by
Union Planters Bank Na
Create a Home Valuation Report for This Property
The Home Valuation Report is an in-depth analysis detailing your home's value as well as a comparison with similar homes in the area
Home Values in the Area
Average Home Value in this Area
Purchase History
| Date | Buyer | Sale Price | Title Company |
|---|---|---|---|
| Rimmer Sean | $65,500 | First Southwestern Title Co | |
| Hud | -- | Benefit Land Title Ins Co | |
| Union Planters Bank Na | $89,810 | Benefit Land Title Ins Co |
Source: Public Records
Mortgage History
| Date | Status | Borrower | Loan Amount |
|---|---|---|---|
| Open | Rimmer Sean | $64,468 |
Source: Public Records
Tax History Compared to Growth
Tax History
| Year | Tax Paid | Tax Assessment Tax Assessment Total Assessment is a certain percentage of the fair market value that is determined by local assessors to be the total taxable value of land and additions on the property. | Land | Improvement |
|---|---|---|---|---|
| 2025 | $1,138 | $100,674 | $15,372 | $85,302 |
| 2024 | $1,138 | $98,700 | $15,071 | $83,629 |
| 2023 | $1,126 | $96,764 | $14,775 | $81,989 |
| 2022 | $1,101 | $94,866 | $14,485 | $80,381 |
| 2021 | $1,082 | $93,006 | $14,201 | $78,805 |
| 2020 | $1,069 | $92,052 | $14,055 | $77,997 |
| 2019 | $1,048 | $90,247 | $13,779 | $76,468 |
| 2018 | $7,884 | $88,478 | $13,509 | $74,969 |
| 2017 | $1,011 | $86,743 | $13,244 | $73,499 |
| 2016 | $991 | $85,042 | $12,984 | $72,058 |
| 2015 | $979 | $83,765 | $12,789 | $70,976 |
| 2014 | $966 | $82,124 | $12,538 | $69,586 |
Source: Public Records
Map
Nearby Homes