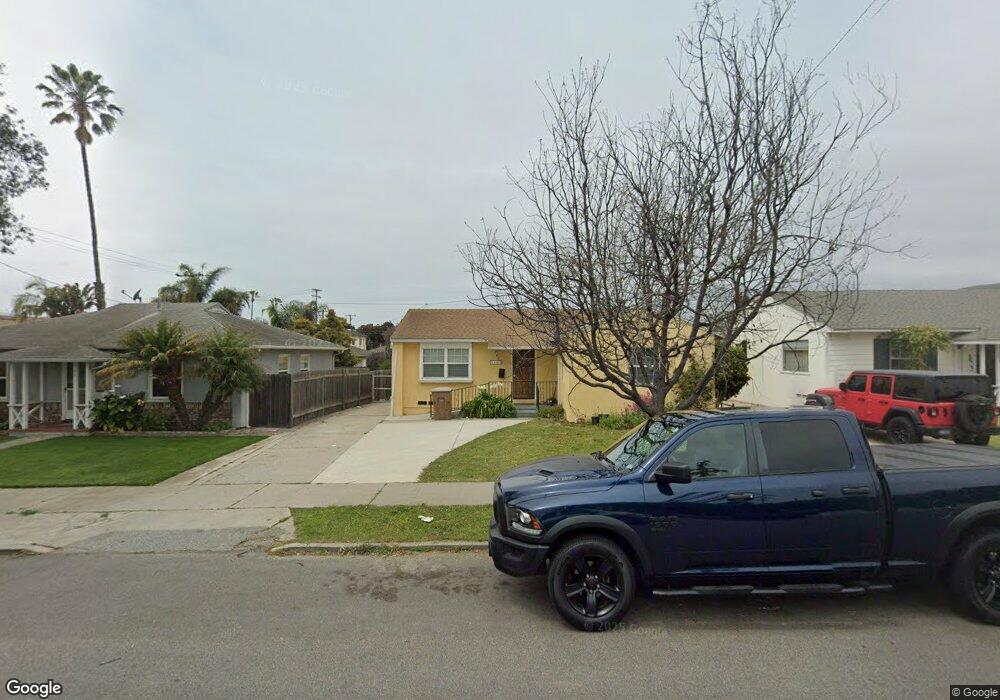
165 Arcade Dr Ventura, CA 93003
Midtown NeighborhoodEstimated Value: $822,000 - $935,000
3
Beds
1
Bath
987
Sq Ft
$878/Sq Ft
Est. Value
About This Home
This home is located at 165 Arcade Dr, Ventura, CA 93003 and is currently estimated at $866,457, approximately $877 per square foot. 165 Arcade Dr is a home located in Ventura County with nearby schools including Will Rogers Elementary School, Cabrillo Middle School, and Ventura High School.
Ownership History
Date
Name
Owned For
Owner Type
Purchase Details
Closed on
Aug 12, 2008
Sold by
Parry Craig and Parry Deena
Bought by
Mejia Socorro
Current Estimated Value
Purchase Details
Closed on
Oct 4, 2007
Sold by
Cdrt Investments
Bought by
Parry Craig and Parry Deena
Purchase Details
Closed on
Sep 18, 2007
Sold by
White Scott and White Lori
Bought by
Cdrt Investments
Purchase Details
Closed on
Jul 7, 2007
Sold by
White Scott
Bought by
Lakeside Group Llc
Purchase Details
Closed on
Mar 22, 1999
Sold by
Adamoli Irene M and Elliott Grant P
Bought by
White Scott and White Lori
Home Financials for this Owner
Home Financials are based on the most recent Mortgage that was taken out on this home.
Original Mortgage
$115,256
Interest Rate
6.96%
Mortgage Type
FHA
Create a Home Valuation Report for This Property
The Home Valuation Report is an in-depth analysis detailing your home's value as well as a comparison with similar homes in the area
Home Values in the Area
Average Home Value in this Area
Purchase History
| Date | Buyer | Sale Price | Title Company |
|---|---|---|---|
| Mejia Socorro | $370,000 | Progressive Title Company | |
| Parry Craig | -- | Progressive Title Company | |
| Cdrt Investments | $94,243 | None Available | |
| Lakeside Group Llc | -- | None Available | |
| White Scott | $116,000 | Lawyers Title Company |
Source: Public Records
Mortgage History
| Date | Status | Borrower | Loan Amount |
|---|---|---|---|
| Previous Owner | White Scott | $115,256 |
Source: Public Records
Tax History Compared to Growth
Tax History
| Year | Tax Paid | Tax Assessment Tax Assessment Total Assessment is a certain percentage of the fair market value that is determined by local assessors to be the total taxable value of land and additions on the property. | Land | Improvement |
|---|---|---|---|---|
| 2025 | $5,199 | $476,455 | $341,249 | $135,206 |
| 2024 | $5,199 | $467,113 | $334,558 | $132,555 |
| 2023 | $5,136 | $457,954 | $327,998 | $129,956 |
| 2022 | $4,785 | $448,975 | $321,567 | $127,408 |
| 2021 | $4,694 | $440,172 | $315,262 | $124,910 |
| 2020 | $4,649 | $435,660 | $312,030 | $123,630 |
| 2019 | $4,564 | $427,118 | $305,912 | $121,206 |
| 2018 | $4,489 | $418,744 | $299,914 | $118,830 |
| 2017 | $4,395 | $410,534 | $294,034 | $116,500 |
| 2016 | $4,310 | $402,485 | $288,269 | $114,216 |
| 2015 | $4,264 | $396,441 | $283,940 | $112,501 |
| 2014 | $4,195 | $388,678 | $278,379 | $110,299 |
Source: Public Records
Map
Nearby Homes
- 205 Jordan Ave
- 69 S Seaward Ave
- 344 S Evergreen Dr
- 400 Arcade Dr
- 1901 Ocean Ave
- 2418 Lexington Dr
- Plan D at Portalvo - Townhomes
- Plan F at Portalvo - Townhomes
- Plan E at Portalvo - Townhomes
- Plan O at Portalvo - Condos/Flats
- Plan A at Portalvo - Townhomes
- Plan H at Portalvo - Condos/Flats
- Plan L at Portalvo - Condos/Flats
- Plan C at Portalvo - Townhomes
- Plan B at Portalvo - Townhomes
- Plan J at Portalvo - Condos/Flats
- Plan G at Portalvo - Townhomes
- Plan N at Portalvo - Condos/Flats
- Plan K at Portalvo - Condos/Flats
- Plan M at Portalvo - Condos/Flats
- 151 Arcade Dr
- 177 Arcade Dr
- 137 Arcade Dr
- 193 Arcade Dr Unit 2
- 193 Arcade Dr
- 182 S Seaward Ave
- 170 S Seaward Ave
- 194 S Seaward Ave
- 123 Arcade Dr
- 156 S Seaward Ave
- 206 S Seaward Ave
- 152 Arcade Dr
- 164 Arcade Dr
- 150 Arcade Dr
- 178 Arcade Dr
- 144 S Seaward Ave
- 136 Arcade Dr
- 192 Arcade Dr
- 122 Arcade Dr
- 130 S Seaward Ave