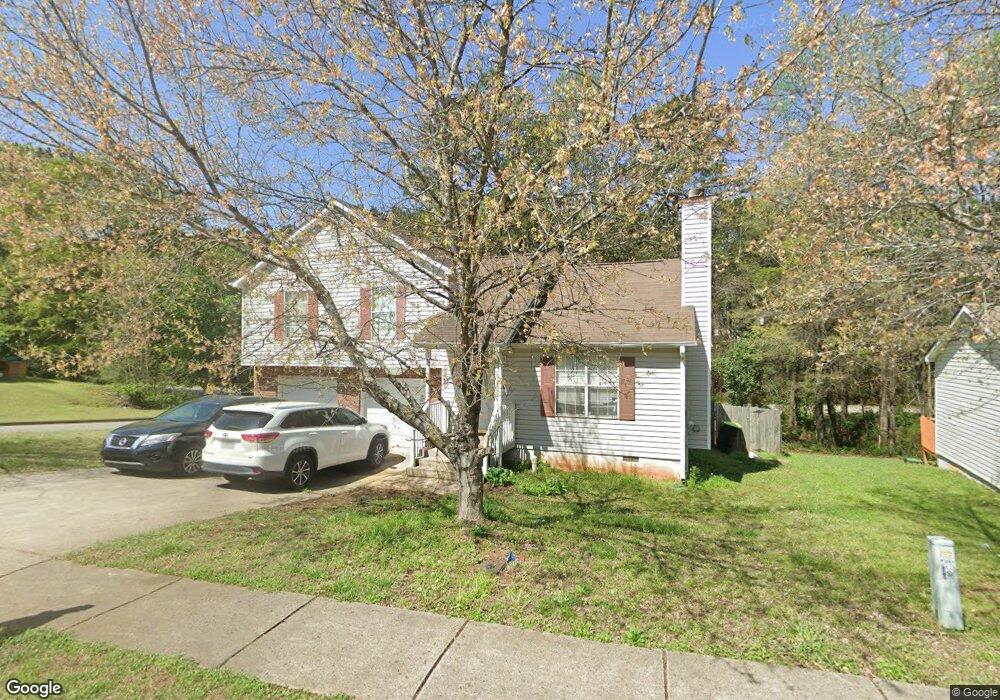
165 Brandon Ridge Cir Stockbridge, GA 30281
Estimated Value: $236,000 - $276,000
3
Beds
2
Baths
1,305
Sq Ft
$192/Sq Ft
Est. Value
About This Home
This home is located at 165 Brandon Ridge Cir, Stockbridge, GA 30281 and is currently estimated at $250,263, approximately $191 per square foot. 165 Brandon Ridge Cir is a home located in Henry County with nearby schools including Stockbridge Elementary School, Smith-Barnes Elementary School, and Stockbridge Middle School.
Ownership History
Date
Name
Owned For
Owner Type
Purchase Details
Closed on
Jun 1, 2008
Sold by
Bank Of New York
Bought by
Brooks Nichelle
Current Estimated Value
Home Financials for this Owner
Home Financials are based on the most recent Mortgage that was taken out on this home.
Original Mortgage
$98,223
Outstanding Balance
$62,723
Interest Rate
6.04%
Mortgage Type
FHA
Estimated Equity
$187,540
Purchase Details
Closed on
Feb 5, 2008
Sold by
Cisse Felice O
Bought by
Jpmirga Chase Bk Na
Purchase Details
Closed on
Apr 30, 1997
Sold by
Contr G T Arch
Bought by
Corona Pamela Ann
Home Financials for this Owner
Home Financials are based on the most recent Mortgage that was taken out on this home.
Original Mortgage
$88,701
Interest Rate
7.98%
Mortgage Type
New Conventional
Create a Home Valuation Report for This Property
The Home Valuation Report is an in-depth analysis detailing your home's value as well as a comparison with similar homes in the area
Home Values in the Area
Average Home Value in this Area
Purchase History
| Date | Buyer | Sale Price | Title Company |
|---|---|---|---|
| Brooks Nichelle | $99,000 | -- | |
| Jpmirga Chase Bk Na | $118,150 | -- | |
| Corona Pamela Ann | $90,800 | -- |
Source: Public Records
Mortgage History
| Date | Status | Borrower | Loan Amount |
|---|---|---|---|
| Open | Brooks Nichelle | $98,223 | |
| Previous Owner | Corona Pamela Ann | $88,701 |
Source: Public Records
Tax History Compared to Growth
Tax History
| Year | Tax Paid | Tax Assessment Tax Assessment Total Assessment is a certain percentage of the fair market value that is determined by local assessors to be the total taxable value of land and additions on the property. | Land | Improvement |
|---|---|---|---|---|
| 2025 | $3,295 | $100,040 | $14,000 | $86,040 |
| 2024 | $3,295 | $97,320 | $14,000 | $83,320 |
| 2023 | $2,726 | $94,720 | $10,000 | $84,720 |
| 2022 | $2,098 | $68,200 | $10,000 | $58,200 |
| 2021 | $1,836 | $57,080 | $10,000 | $47,080 |
| 2020 | $1,750 | $53,440 | $8,000 | $45,440 |
| 2019 | $1,569 | $46,240 | $8,000 | $38,240 |
| 2018 | $1,436 | $42,760 | $8,000 | $34,760 |
| 2016 | $1,332 | $40,040 | $6,000 | $34,040 |
| 2015 | $1,009 | $31,120 | $6,000 | $25,120 |
| 2014 | $766 | $24,840 | $4,800 | $20,040 |
Source: Public Records
Map
Nearby Homes
- 9 Cheyenne Dr
- 318 Eagle Ct
- 213 Baron Ct
- 32 Bay Cove Dr
- 44 Bay Cove Dr
- 184 Eagle Way
- 816 Lorraine Ln Unit 4
- 235 Alexis Ave
- 564 Goldfinch Way
- 537 Goldfinch Way
- 0 Tye St Unit 10634748
- 0 Tye St Unit 20124844
- 843 Tramore Dr
- 396 Avian Forest Dr
- 377 Avian Forest Dr
- 323 Tramore Pass
- 137 Dustin Dr
- 614 Tramore Ct
- 172 Garden Walk
- 503 Goldfinch Way
- 169 Brandon Ridge Cir
- 0 Brandon Ridge Cir Unit 8654307
- 0 Brandon Ridge Cir Unit 8162975
- 0 Brandon Ridge Cir Unit 8007704
- 0 Brandon Ridge Cir Unit 3208141
- 0 Brandon Ridge Cir Unit 7639409
- 0 Brandon Ridge Cir Unit 7580374
- 0 Brandon Ridge Cir Unit 7343127
- 0 Brandon Ridge Cir Unit 8708474
- 0 Brandon Ridge Cir Unit 8630444
- 0 Brandon Ridge Cir Unit 3160927
- 0 Brandon Ridge Cir Unit 3264224
- 0 Brandon Ridge Cir Unit 3280122
- 0 Brandon Ridge Cir Unit 7010550
- 155 Brandon Ridge Cir
- 173 Brandon Ridge Cir
- 164 Brandon Ridge Cir
- 716 Johnson Ct Unit 4
- 170 Brandon Ridge Cir
- 720 Johnson Ct