Estimated Value: $353,000 - $485,000
3
Beds
2
Baths
1,585
Sq Ft
$257/Sq Ft
Est. Value
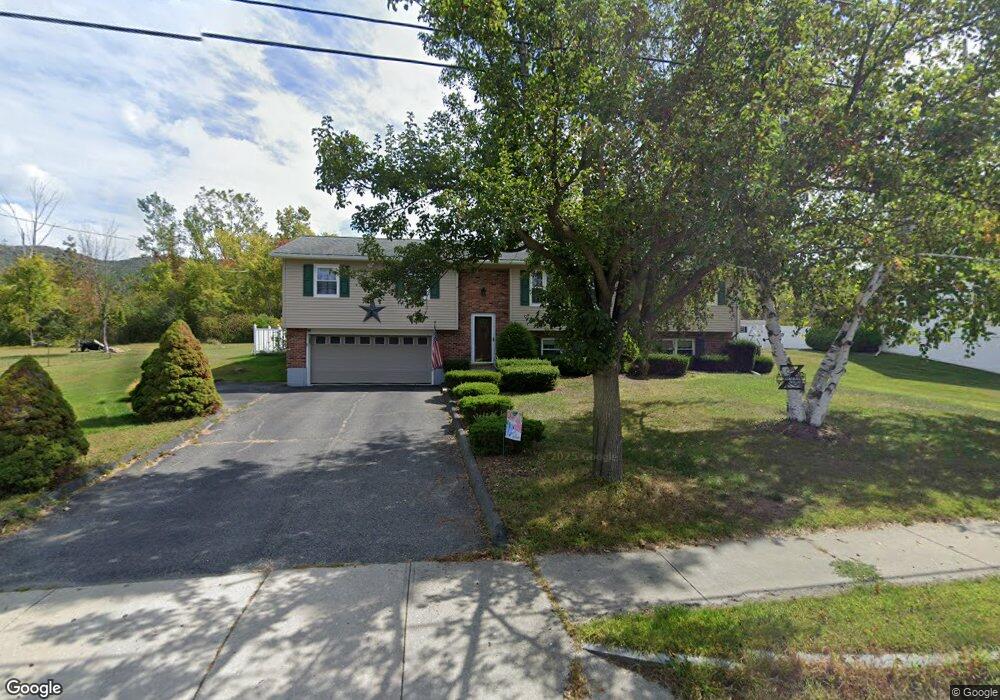
About This Home
This home is located at 165 East Rd, Adams, MA 01220 and is currently estimated at $407,644, approximately $257 per square foot. 165 East Rd is a home located in Berkshire County with nearby schools including Hoosac Valley Middle & High School, Berkshire Arts & Technology Charter Public School, and St. Stanislaus Kostka School.
Ownership History
Date
Name
Owned For
Owner Type
Purchase Details
Closed on
Jun 27, 2019
Sold by
Maroni Cary M and Maroni Deborah L
Bought by
Ziemba Maria T
Current Estimated Value
Purchase Details
Closed on
Jun 26, 2019
Sold by
Stohlmann Arthur J Est and Stohlmann
Bought by
Maroni Cary M and Maroni Deborah L
Purchase Details
Closed on
Jan 2, 1981
Bought by
Maroni Cary M and Maroni Deborah L
Create a Home Valuation Report for This Property
The Home Valuation Report is an in-depth analysis detailing your home's value as well as a comparison with similar homes in the area
Home Values in the Area
Average Home Value in this Area
Purchase History
| Date | Buyer | Sale Price | Title Company |
|---|---|---|---|
| Ziemba Maria T | -- | -- | |
| Maroni Cary M | $5,000 | -- | |
| Maroni Cary M | $7,500 | -- |
Source: Public Records
Mortgage History
| Date | Status | Borrower | Loan Amount |
|---|---|---|---|
| Previous Owner | Maroni Cary M | $140,000 | |
| Previous Owner | Maroni Cary M | $41,000 | |
| Previous Owner | Maroni Cary M | $25,000 |
Source: Public Records
Tax History
| Year | Tax Paid | Tax Assessment Tax Assessment Total Assessment is a certain percentage of the fair market value that is determined by local assessors to be the total taxable value of land and additions on the property. | Land | Improvement |
|---|---|---|---|---|
| 2025 | $5,846 | $343,700 | $55,400 | $288,300 |
| 2024 | $5,502 | $313,700 | $52,100 | $261,600 |
| 2023 | $5,094 | $274,600 | $46,400 | $228,200 |
| 2022 | $4,976 | $238,200 | $40,400 | $197,800 |
| 2021 | $4,823 | $213,200 | $40,400 | $172,800 |
| 2020 | $4,614 | $210,900 | $40,600 | $170,300 |
| 2019 | $4,511 | $210,900 | $40,600 | $170,300 |
| 2018 | $4,160 | $187,300 | $40,600 | $146,700 |
| 2017 | $4,003 | $187,300 | $40,600 | $146,700 |
| 2016 | $3,683 | $172,200 | $40,600 | $131,600 |
| 2015 | $3,582 | $167,600 | $42,500 | $125,100 |
| 2014 | $3,344 | $167,600 | $42,500 | $125,100 |
Source: Public Records
Map
Nearby Homes
Your Personal Tour Guide
Ask me questions while you tour the home.