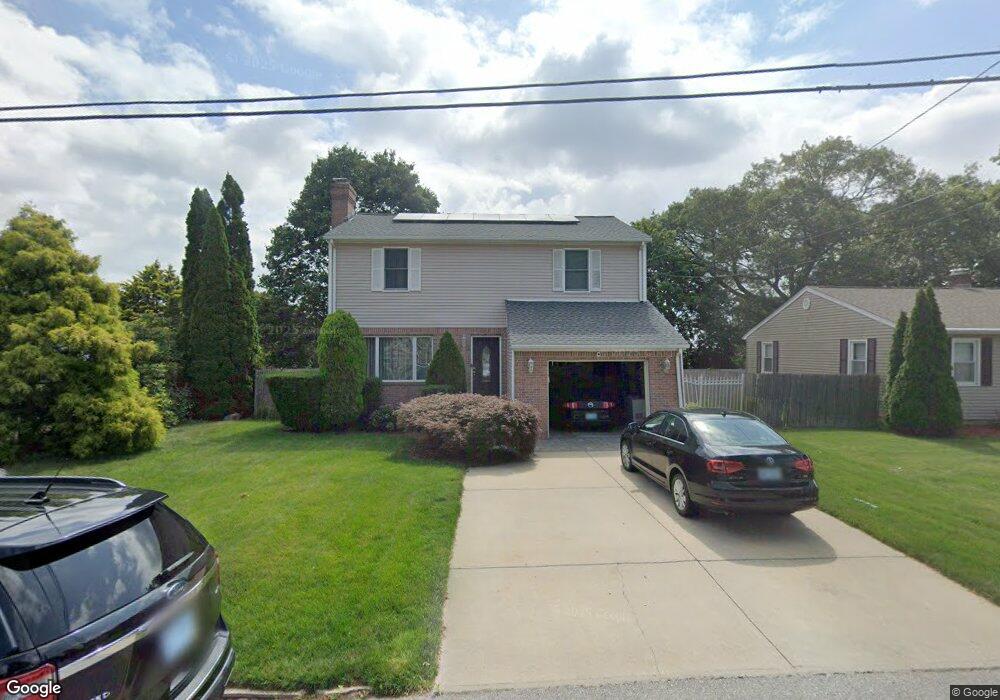
165 Hope St Cumberland, RI 02864
Valley Falls NeighborhoodEstimated Value: $534,060 - $589,000
3
Beds
3
Baths
2,454
Sq Ft
$231/Sq Ft
Est. Value
About This Home
This home is located at 165 Hope St, Cumberland, RI 02864 and is currently estimated at $567,515, approximately $231 per square foot. 165 Hope St is a home located in Providence County with nearby schools including B.F. Norton Elementary School, Joseph L. McCourt Middle School, and Cumberland High School.
Ownership History
Date
Name
Owned For
Owner Type
Purchase Details
Closed on
Oct 26, 2007
Sold by
Marques Ermelinda R
Bought by
Neves Guilherme D and Neves Debora
Current Estimated Value
Purchase Details
Closed on
Sep 19, 2000
Sold by
Silva Arthur J and Silva Lis Ann
Bought by
Marques Ermelinda R
Purchase Details
Closed on
Oct 27, 1993
Sold by
Rereira Rui and Rereira Anna
Bought by
Silva Artur J and Silva Lisa
Create a Home Valuation Report for This Property
The Home Valuation Report is an in-depth analysis detailing your home's value as well as a comparison with similar homes in the area
Home Values in the Area
Average Home Value in this Area
Purchase History
| Date | Buyer | Sale Price | Title Company |
|---|---|---|---|
| Neves Guilherme D | $305,000 | -- | |
| Marques Ermelinda R | $182,500 | -- | |
| Silva Artur J | $115,000 | -- |
Source: Public Records
Mortgage History
| Date | Status | Borrower | Loan Amount |
|---|---|---|---|
| Open | Silva Artur J | $220,000 | |
| Closed | Silva Artur J | $212,250 | |
| Closed | Silva Artur J | $220,500 |
Source: Public Records
Tax History Compared to Growth
Tax History
| Year | Tax Paid | Tax Assessment Tax Assessment Total Assessment is a certain percentage of the fair market value that is determined by local assessors to be the total taxable value of land and additions on the property. | Land | Improvement |
|---|---|---|---|---|
| 2025 | $5,326 | $434,100 | $125,400 | $308,700 |
| 2024 | $5,187 | $434,100 | $125,400 | $308,700 |
| 2023 | $5,044 | $434,100 | $125,400 | $308,700 |
| 2022 | $4,803 | $320,400 | $87,700 | $232,700 |
| 2021 | $4,723 | $320,400 | $87,700 | $232,700 |
| 2020 | $4,588 | $320,400 | $87,700 | $232,700 |
| 2019 | $4,685 | $295,000 | $73,300 | $221,700 |
| 2018 | $4,549 | $295,000 | $73,300 | $221,700 |
| 2017 | $4,487 | $295,000 | $73,300 | $221,700 |
| 2016 | $4,234 | $247,900 | $64,700 | $183,200 |
| 2015 | $4,234 | $247,900 | $64,700 | $183,200 |
| 2014 | $5,936 | $247,900 | $64,700 | $183,200 |
| 2013 | $4,063 | $257,500 | $65,700 | $191,800 |
Source: Public Records
Map
Nearby Homes